
SL Paper 2
A wind turbine is designed so that the rotation of the blades generates electricity. The turbine is built on horizontal ground and is made up of a vertical tower and three blades.
The point is on the base of the tower directly below point at the top of the tower. The height of the tower, , is . The blades of the turbine are centred at and are each of length . This is shown in the following diagram.

The end of one of the blades of the turbine is represented by point on the diagram. Let be the height of above the ground, measured in metres, where varies as the blade rotates.
Find the
The blades of the turbine complete rotations per minute under normal conditions, moving at a constant rate.
The height, , of point can be modelled by the following function. Time, , is measured from the instant when the blade first passes and is measured in seconds.
Looking through his window, Tim has a partial view of the rotating wind turbine. The position of his window means that he cannot see any part of the wind turbine that is more than above the ground. This is illustrated in the following diagram.

maximum value of .
minimum value of .
Find the time, in seconds, it takes for the blade to make one complete rotation under these conditions.
Calculate the angle, in degrees, that the blade turns through in one second.
Write down the amplitude of the function.
Find the period of the function.
Sketch the function for , clearly labelling the coordinates of the maximum and minimum points.
Find the height of above the ground when .
Find the time, in seconds, that point is above a height of , during each complete rotation.
At any given instant, find the probability that point is visible from Tim’s window.
The wind speed increases. The blades rotate at twice the speed, but still at a constant rate.
At any given instant, find the probability that Tim can see point from his window. Justify your answer.
Markscheme
maximum metres A1
[1 mark]
minimum metres A1
[1 mark]
A1
[1 mark]
(M1)
Note: Award (M1) for divided by their time for one revolution.
A1
[2 marks]
(amplitude =) A1
[1 mark]
(period ) A1
[1 mark]

Maximum point labelled with correct coordinates. A1
At least one minimum point labelled. Coordinates seen for any minimum points must be correct. A1
Correct shape with an attempt at symmetry and “concave up" evident as it approaches the minimum points. Graph must be drawn in the given domain. A1
[3 marks]
(M1)
A1
[2 marks]
evidence of on graph OR (M1)
coordinates OR or equivalent (A1)
Note: Award A1 for either -coordinate seen.
seconds A1
[3 marks]
(M1)
(M1)
A1
[3 marks]
METHOD 1
changing the frequency/dilation of the graph will not change the proportion of time that point is visible. A1
A1
METHOD 2
correct calculation of relevant found values
A1
A1
Note: Award A0A1 for an unsupported correct probability.
[2 marks]
Examiners report
Judging by the responses in parts (a), (b) and (c), transferring and interpreting the information from a diagram is a skill that requires further nurturing. The amplitude should be expressed as a positive value. Overall, the sketch of reflected the correct general shape. Common flaws included a lack of symmetry about the mean, 'concave up' not evident as the curve approached the minimum points, and the curve being drawn beyond the given domain. At least one correct pair of coordinates was seen, though some gave their answers inaccurately, suggesting they found an approximate solution using the "trace" feature in their GDC. Most were able to find the height of point when and make an attempt to find a time at which point is at a height of . It was pleasing to see a number of candidates draw on their sketch, which would no doubt have assisted the candidates in visualizing the solution. Part (f) proved to be a high-grade discriminator, with few attaining full marks. Premature rounding in part (f)(i) resulted in an inaccurate final answer. It is recommended that candidates retrieve and use unrounded values from previous calculations in their GDC. Though many recognized the probability was independent of the speed of rotation, most were not able to support their answer through a correct calculation or written explanation.
Judging by the responses in parts (a), (b) and (c), transferring and interpreting the information from a diagram is a skill that requires further nurturing. The amplitude should be expressed as a positive value. Overall, the sketch of reflected the correct general shape. Common flaws included a lack of symmetry about the mean, 'concave up' not evident as the curve approached the minimum points, and the curve being drawn beyond the given domain. At least one correct pair of coordinates was seen, though some gave their answers inaccurately, suggesting they found an approximate solution using the "trace" feature in their GDC. Most were able to find the height of point when and make an attempt to find a time at which point is at a height of . It was pleasing to see a number of candidates draw on their sketch, which would no doubt have assisted the candidates in visualizing the solution. Part (f) proved to be a high-grade discriminator, with few attaining full marks. Premature rounding in part (f)(i) resulted in an inaccurate final answer. It is recommended that candidates retrieve and use unrounded values from previous calculations in their GDC. Though many recognized the probability was independent of the speed of rotation, most were not able to support their answer through a correct calculation or written explanation.
Judging by the responses in parts (a), (b) and (c), transferring and interpreting the information from a diagram is a skill that requires further nurturing. The amplitude should be expressed as a positive value. Overall, the sketch of reflected the correct general shape. Common flaws included a lack of symmetry about the mean, 'concave up' not evident as the curve approached the minimum points, and the curve being drawn beyond the given domain. At least one correct pair of coordinates was seen, though some gave their answers inaccurately, suggesting they found an approximate solution using the "trace" feature in their GDC. Most were able to find the height of point when and make an attempt to find a time at which point is at a height of . It was pleasing to see a number of candidates draw on their sketch, which would no doubt have assisted the candidates in visualizing the solution. Part (f) proved to be a high-grade discriminator, with few attaining full marks. Premature rounding in part (f)(i) resulted in an inaccurate final answer. It is recommended that candidates retrieve and use unrounded values from previous calculations in their GDC. Though many recognized the probability was independent of the speed of rotation, most were not able to support their answer through a correct calculation or written explanation.
Judging by the responses in parts (a), (b) and (c), transferring and interpreting the information from a diagram is a skill that requires further nurturing. The amplitude should be expressed as a positive value. Overall, the sketch of reflected the correct general shape. Common flaws included a lack of symmetry about the mean, 'concave up' not evident as the curve approached the minimum points, and the curve being drawn beyond the given domain. At least one correct pair of coordinates was seen, though some gave their answers inaccurately, suggesting they found an approximate solution using the "trace" feature in their GDC. Most were able to find the height of point when and make an attempt to find a time at which point is at a height of . It was pleasing to see a number of candidates draw on their sketch, which would no doubt have assisted the candidates in visualizing the solution. Part (f) proved to be a high-grade discriminator, with few attaining full marks. Premature rounding in part (f)(i) resulted in an inaccurate final answer. It is recommended that candidates retrieve and use unrounded values from previous calculations in their GDC. Though many recognized the probability was independent of the speed of rotation, most were not able to support their answer through a correct calculation or written explanation.
Judging by the responses in parts (a), (b) and (c), transferring and interpreting the information from a diagram is a skill that requires further nurturing. The amplitude should be expressed as a positive value. Overall, the sketch of reflected the correct general shape. Common flaws included a lack of symmetry about the mean, 'concave up' not evident as the curve approached the minimum points, and the curve being drawn beyond the given domain. At least one correct pair of coordinates was seen, though some gave their answers inaccurately, suggesting they found an approximate solution using the "trace" feature in their GDC. Most were able to find the height of point when and make an attempt to find a time at which point is at a height of . It was pleasing to see a number of candidates draw on their sketch, which would no doubt have assisted the candidates in visualizing the solution. Part (f) proved to be a high-grade discriminator, with few attaining full marks. Premature rounding in part (f)(i) resulted in an inaccurate final answer. It is recommended that candidates retrieve and use unrounded values from previous calculations in their GDC. Though many recognized the probability was independent of the speed of rotation, most were not able to support their answer through a correct calculation or written explanation.
Judging by the responses in parts (a), (b) and (c), transferring and interpreting the information from a diagram is a skill that requires further nurturing. The amplitude should be expressed as a positive value. Overall, the sketch of reflected the correct general shape. Common flaws included a lack of symmetry about the mean, 'concave up' not evident as the curve approached the minimum points, and the curve being drawn beyond the given domain. At least one correct pair of coordinates was seen, though some gave their answers inaccurately, suggesting they found an approximate solution using the "trace" feature in their GDC. Most were able to find the height of point when and make an attempt to find a time at which point is at a height of . It was pleasing to see a number of candidates draw on their sketch, which would no doubt have assisted the candidates in visualizing the solution. Part (f) proved to be a high-grade discriminator, with few attaining full marks. Premature rounding in part (f)(i) resulted in an inaccurate final answer. It is recommended that candidates retrieve and use unrounded values from previous calculations in their GDC. Though many recognized the probability was independent of the speed of rotation, most were not able to support their answer through a correct calculation or written explanation.
Judging by the responses in parts (a), (b) and (c), transferring and interpreting the information from a diagram is a skill that requires further nurturing. The amplitude should be expressed as a positive value. Overall, the sketch of reflected the correct general shape. Common flaws included a lack of symmetry about the mean, 'concave up' not evident as the curve approached the minimum points, and the curve being drawn beyond the given domain. At least one correct pair of coordinates was seen, though some gave their answers inaccurately, suggesting they found an approximate solution using the "trace" feature in their GDC. Most were able to find the height of point when and make an attempt to find a time at which point is at a height of . It was pleasing to see a number of candidates draw on their sketch, which would no doubt have assisted the candidates in visualizing the solution. Part (f) proved to be a high-grade discriminator, with few attaining full marks. Premature rounding in part (f)(i) resulted in an inaccurate final answer. It is recommended that candidates retrieve and use unrounded values from previous calculations in their GDC. Though many recognized the probability was independent of the speed of rotation, most were not able to support their answer through a correct calculation or written explanation.
Judging by the responses in parts (a), (b) and (c), transferring and interpreting the information from a diagram is a skill that requires further nurturing. The amplitude should be expressed as a positive value. Overall, the sketch of reflected the correct general shape. Common flaws included a lack of symmetry about the mean, 'concave up' not evident as the curve approached the minimum points, and the curve being drawn beyond the given domain. At least one correct pair of coordinates was seen, though some gave their answers inaccurately, suggesting they found an approximate solution using the "trace" feature in their GDC. Most were able to find the height of point when and make an attempt to find a time at which point is at a height of . It was pleasing to see a number of candidates draw on their sketch, which would no doubt have assisted the candidates in visualizing the solution. Part (f) proved to be a high-grade discriminator, with few attaining full marks. Premature rounding in part (f)(i) resulted in an inaccurate final answer. It is recommended that candidates retrieve and use unrounded values from previous calculations in their GDC. Though many recognized the probability was independent of the speed of rotation, most were not able to support their answer through a correct calculation or written explanation.
Judging by the responses in parts (a), (b) and (c), transferring and interpreting the information from a diagram is a skill that requires further nurturing. The amplitude should be expressed as a positive value. Overall, the sketch of reflected the correct general shape. Common flaws included a lack of symmetry about the mean, 'concave up' not evident as the curve approached the minimum points, and the curve being drawn beyond the given domain. At least one correct pair of coordinates was seen, though some gave their answers inaccurately, suggesting they found an approximate solution using the "trace" feature in their GDC. Most were able to find the height of point when and make an attempt to find a time at which point is at a height of . It was pleasing to see a number of candidates draw on their sketch, which would no doubt have assisted the candidates in visualizing the solution. Part (f) proved to be a high-grade discriminator, with few attaining full marks. Premature rounding in part (f)(i) resulted in an inaccurate final answer. It is recommended that candidates retrieve and use unrounded values from previous calculations in their GDC. Though many recognized the probability was independent of the speed of rotation, most were not able to support their answer through a correct calculation or written explanation.
Judging by the responses in parts (a), (b) and (c), transferring and interpreting the information from a diagram is a skill that requires further nurturing. The amplitude should be expressed as a positive value. Overall, the sketch of reflected the correct general shape. Common flaws included a lack of symmetry about the mean, 'concave up' not evident as the curve approached the minimum points, and the curve being drawn beyond the given domain. At least one correct pair of coordinates was seen, though some gave their answers inaccurately, suggesting they found an approximate solution using the "trace" feature in their GDC. Most were able to find the height of point when and make an attempt to find a time at which point is at a height of . It was pleasing to see a number of candidates draw on their sketch, which would no doubt have assisted the candidates in visualizing the solution. Part (f) proved to be a high-grade discriminator, with few attaining full marks. Premature rounding in part (f)(i) resulted in an inaccurate final answer. It is recommended that candidates retrieve and use unrounded values from previous calculations in their GDC. Though many recognized the probability was independent of the speed of rotation, most were not able to support their answer through a correct calculation or written explanation.
Judging by the responses in parts (a), (b) and (c), transferring and interpreting the information from a diagram is a skill that requires further nurturing. The amplitude should be expressed as a positive value. Overall, the sketch of reflected the correct general shape. Common flaws included a lack of symmetry about the mean, 'concave up' not evident as the curve approached the minimum points, and the curve being drawn beyond the given domain. At least one correct pair of coordinates was seen, though some gave their answers inaccurately, suggesting they found an approximate solution using the "trace" feature in their GDC. Most were able to find the height of point when and make an attempt to find a time at which point is at a height of . It was pleasing to see a number of candidates draw on their sketch, which would no doubt have assisted the candidates in visualizing the solution. Part (f) proved to be a high-grade discriminator, with few attaining full marks. Premature rounding in part (f)(i) resulted in an inaccurate final answer. It is recommended that candidates retrieve and use unrounded values from previous calculations in their GDC. Though many recognized the probability was independent of the speed of rotation, most were not able to support their answer through a correct calculation or written explanation.
The following table shows values of ln x and ln y.

The relationship between ln x and ln y can be modelled by the regression equation ln y = a ln x + b.
Find the value of a and of b.
Use the regression equation to estimate the value of y when x = 3.57.
The relationship between x and y can be modelled using the formula y = kxn, where k ≠ 0 , n ≠ 0 , n ≠ 1.
By expressing ln y in terms of ln x, find the value of n and of k.
Markscheme
* This question is from an exam for a previous syllabus, and may contain minor differences in marking or structure.
valid approach (M1)
eg one correct value
−0.453620, 6.14210
a = −0.454, b = 6.14 A1A1 N3
[3 marks]
correct substitution (A1)
eg −0.454 ln 3.57 + 6.14
correct working (A1)
eg ln y = 5.56484
261.083 (260.409 from 3 sf)
y = 261, (y = 260 from 3sf) A1 N3
Note: If no working shown, award N1 for 5.56484.
If no working shown, award N2 for ln y = 5.56484.
[3 marks]
METHOD 1
valid approach for expressing ln y in terms of ln x (M1)
eg
correct application of addition rule for logs (A1)
eg
correct application of exponent rule for logs A1
eg
comparing one term with regression equation (check FT) (M1)
eg
correct working for k (A1)
eg
465.030
(464 from 3sf) A1A1 N2N2
METHOD 2
valid approach (M1)
eg
correct use of exponent laws for (A1)
eg
correct application of exponent rule for (A1)
eg
correct equation in y A1
eg
comparing one term with equation of model (check FT) (M1)
eg
465.030
(464 from 3sf) A1A1 N2N2
METHOD 3
valid approach for expressing ln y in terms of ln x (seen anywhere) (M1)
eg
correct application of exponent rule for logs (seen anywhere) (A1)
eg
correct working for b (seen anywhere) (A1)
eg
correct application of addition rule for logs A1
eg
comparing one term with equation of model (check FT) (M1)
eg
465.030
(464 from 3sf) A1A1 N2N2
[7 marks]
Examiners report
In the month before their IB Diploma examinations, eight male students recorded the number of hours they spent on social media.
For each student, the number of hours spent on social media () and the number of IB Diploma points obtained () are shown in the following table.

Use your graphic display calculator to find
Ten female students also recorded the number of hours they spent on social media in the month before their IB Diploma examinations. Each of these female students spent between 3 and 30 hours on social media.
The equation of the regression line y on x for these ten female students is
An eleventh girl spent 34 hours on social media in the month before her IB Diploma examinations.
On graph paper, draw a scatter diagram for these data. Use a scale of 2 cm to represent 5 hours on the -axis and 2 cm to represent 10 points on the -axis.
(i) , the mean number of hours spent on social media;
(ii) , the mean number of IB Diploma points.
Plot the point on your scatter diagram and label this point M.
Write down the equation of the regression line on for these eight male students.
Draw the regression line, from part (e), on your scatter diagram.
Use the given equation of the regression line to estimate the number of IB Diploma points that this girl obtained.
Write down a reason why this estimate is not reliable.
Markscheme
* This question is from an exam for a previous syllabus, and may contain minor differences in marking or structure.
 (A4)
(A4)
Notes: Award (A1) for correct scale and labelled axes.
Award (A3) for 7 or 8 points correctly plotted,
(A2) for 5 or 6 points correctly plotted,
(A1) for 3 or 4 points correctly plotted.
Award at most (A0)(A3) if axes reversed.
Accept and sufficient for labelling.
If graph paper is not used, award (A0).
If an inconsistent scale is used, award (A0). Candidates’ points should be read from this scale where possible and awarded accordingly.
A scale which is too small to be meaningful (ie mm instead of cm) earns (A0) for plotted points.
[4 marks]
(i) (A1)
(ii) (A1)
[2 marks]
correctly plotted on graph (A1)(ft)
this point labelled M (A1)
Note: Follow through from parts (b)(i) and (b)(ii).
Only accept M for labelling.
[2 marks]
(A1)(A1)(G2)
Notes: Award (A1) for and (A1) . Award a maximum of (A1)(A0) if answer is not an equation.
[2 marks]
line on graph (A1)(ft)(A1)(ft)
Notes: Award (A1)(ft) for straight line that passes through their M, (A1)(ft) for line (extrapolated if necessary) that passes through .
If M is not plotted or labelled, follow through from part (e).
[2 marks]
(M1)
Note: Award (M1) for correct substitution.
19 (points) (A1)(G2)
[2 marks]
extrapolation (R1)
OR
34 hours is outside the given range of data (R1)
Note: Do not accept ‘outlier’.
[1 mark]
Examiners report
A medical centre is testing patients for a certain disease. This disease occurs in of the population.
They test every patient who comes to the centre on a particular day.
It is intended that if a patient has the disease, they test “positive”, and if a patient does not have the disease, they test “negative”.
However, the tests are not perfect, and only of people who have the disease test positive. Also, of people who do not have the disease test positive.
The tree diagram shows some of this information.

Write down the value of
Use the tree diagram to find the probability that a patient selected at random
The staff at the medical centre looked at the care received by all visiting patients on a randomly chosen day. All the patients received at least one of these services: they had medical tests (), were seen by a nurse (), or were seen by a doctor (). It was found that:
- had medical tests,
- were seen by a nurse;
- were seen by a doctor;
- had medical tests and were seen by a doctor and a nurse;
- had medical tests and were seen by a doctor but were not seen by a nurse;
- patients were seen by a nurse and had medical tests but were not seen by a doctor;
- patients were seen by a doctor without being seen by nurse and without having medical tests.
State the sampling method being used.
.
.
.
.
will not have the disease and will test positive.
will test negative.
has the disease given that they tested negative.
The medical centre finds the actual number of positive results in their sample is different than predicted by the tree diagram. Explain why this might be the case.
Draw a Venn diagram to illustrate this information, placing all relevant information on the diagram.
Find the total number of patients who visited the centre during this day.
Markscheme
convenience sampling (A1)
[1 mark]
A1
[1 mark]
A1
[1 mark]
A1
[1 mark]
A1
[1 mark]
(M1)
A1
[2 marks]
(M1)(M1)
Note: Award M1 for summing two products and M1 for correct products seen.
A1
[3 marks]
recognition of conditional probability (M1)
A1
A1
Note: Accept if used.
[3 marks]
EITHER
sample may not be representative of population A1
OR
sample is not randomly selected A1
OR
unrealistic to think expected and observed values will be exactly equal A1
[1 mark]
 A1A1A1
Note: Award A1 for rectangle and labelled circles and in centre region; A1 for ; A1 for and .
[3 marks]
(M1)
A1
Note: Follow through from the entries on their Venn diagram in part (e). Working required for FT.
[2 marks]
Examiners report
A group of 800 students answered 40 questions on a category of their choice out of History, Science and Literature.
For each student the category and the number of correct answers, , was recorded. The results obtained are represented in the following table.

A test at the 5% significance level is carried out on the results. The critical value for this test is 12.592.
State whether is a discrete or a continuous variable.
Write down, for , the modal class;
Write down, for , the mid-interval value of the modal class.
Use your graphic display calculator to estimate the mean of ;
Use your graphic display calculator to estimate the standard deviation of .
Find the expected frequency of students choosing the Science category and obtaining 31 to 40 correct answers.
Write down the null hypothesis for this test;
Write down the number of degrees of freedom.
Write down the -value for the test;
Write down the statistic.
State the result of the test. Give a reason for your answer.
Markscheme
* This question is from an exam for a previous syllabus, and may contain minor differences in marking or structure.
discrete (A1)
[1 mark]
(A1)
[1 mark]
15.5 (A1)(ft)
Note: Follow through from part (b)(i).
[1 mark]
(G2)
[2 marks]
(G1)
[1 marks]
OR (M1)
Note: Award (M1) for correct substitution into expected frequency formula.
(A1)(G2)
[2 marks]
choice of category and number of correct answers are independent (A1)
Notes: Accept “no association” between (choice of) category and number of correct answers. Do not accept “not related” or “not correlated” or “influenced”.
[1 mark]
6 (A1)
[1 mark]
(G1)
[1 mark]
(G2)
[2 marks]
the null hypothesis is not rejected (the null hypothesis is accepted) (A1)(ft)
OR
(choice of) category and number of correct answers are independent (A1)(ft)
as OR (R1)
Notes: Award (R1) for a correct comparison of either their statistic to the critical value or their -value to the significance level. Award (A1)(ft) from that comparison.
Follow through from part (f). Do not award (A1)(ft)(R0).
[2 marks]
Examiners report
Fiona walks from her house to a bus stop where she gets a bus to school. Her time, minutes, to walk to the bus stop is normally distributed with .
Fiona always leaves her house at 07:15. The first bus that she can get departs at 07:30.
The length of time, minutes, of the bus journey to Fiona’s school is normally distributed with . The probability that the bus journey takes less than minutes is .
If Fiona misses the first bus, there is a second bus which departs at 07:45. She must arrive at school by 08:30 to be on time. Fiona will not arrive on time if she misses both buses. The variables and are independent.
Find the probability that it will take Fiona between minutes and minutes to walk to the bus stop.
Find .
Find the probability that the bus journey takes less than minutes.
Find the probability that Fiona will arrive on time.
This year, Fiona will go to school on days.
Calculate the number of days Fiona is expected to arrive on time.
Markscheme
* This question is from an exam for a previous syllabus, and may contain minor differences in marking or structure.
A2 N2
[2 marks]
finding standardized value for (A1)
eg
correct substitution using their -value (A1)
eg
A1 N3
[3 marks]
A2 N2
[2 marks]
valid attempt to find one possible way of being on time (do not penalize incorrect use of strict inequality signs) (M1)
eg and , and
correct calculation for (seen anywhere) (A1)
eg
correct calculation for (seen anywhere) (A1)
eg
correct working (A1)
eg
(on time) A1 N2
[5 marks]
recognizing binomial with (M1)
eg
( from )
A1 N2
[2 marks]
Examiners report
A company performs an experiment on the efficiency of a liquid that is used to detect a nut allergy.
A group of 60 people took part in the experiment. In this group 26 are allergic to nuts. One person from the group is chosen at random.
A second person is chosen from the group.
When the liquid is added to a person’s blood sample, it is expected to turn blue if the person is allergic to nuts and to turn red if the person is not allergic to nuts.
The company claims that the probability that the test result is correct is 98% for people who are allergic to nuts and 95% for people who are not allergic to nuts.
It is known that 6 in every 1000 adults are allergic to nuts.
This information can be represented in a tree diagram.

An adult, who was not part of the original group of 60, is chosen at random and tested using this liquid.
The liquid is used in an office to identify employees who might be allergic to nuts. The liquid turned blue for 38 employees.
Find the probability that this person is not allergic to nuts.
Find the probability that both people chosen are not allergic to nuts.
Copy and complete the tree diagram.
Find the probability that this adult is allergic to nuts and the liquid turns blue.
Find the probability that the liquid turns blue.
Find the probability that the tested adult is allergic to nuts given that the liquid turned blue.
Estimate the number of employees, from this 38, who are allergic to nuts.
Markscheme
* This question is from an exam for a previous syllabus, and may contain minor differences in marking or structure.
(A1)(A1)
Note: Award (A1) for correct numerator, (A1) for correct denominator.
[2 marks]
(M1)
Note: Award (M1) for their correct product.
(A1)(ft)(G2)
Note: Follow through from part (a).
[2 marks]
 (A1)(A1)(A1)
Note: Award (A1) for each correct pair of branches.
[3 marks]
(M1)
Note: Award (M1) for multiplying 0.006 by 0.98.
(A1)(G2)
[2 marks]
(A1)(ft)(M1)
Note: Award (A1)(ft) for their two correct products, (M1) for adding two products.
(A1)(ft)(G3)
Note: Follow through from parts (c) and (d).
[3 marks]
(M1)(M1)
Note: Award (M1) for their correct numerator, (M1) for their correct denominator.
(A1)(ft)(G3)
Note: Follow through from parts (d) and (e).
[3 marks]
(M1)
Note: Award (M1) for multiplying 38 by their answer to part (f).
(A1)(ft)(G2)
Notes: Follow through from part (f). Use of 3 sf result from part (f) results in an answer of 4.03 (4.028).
[2 marks]
Examiners report
A survey was conducted on a group of people. The first question asked how many pets they each own. The results are summarized in the following table.

The second question asked each member of the group to state their age and preferred pet. The data obtained is organized in the following table.

A test is carried out at the 10 % significance level.
Write down the total number of people, from this group, who are pet owners.
Write down the modal number of pets.
For these data, write down the median number of pets.
For these data, write down the lower quartile.
For these data, write down the upper quartile.
Write down the ratio of teenagers to non-teenagers in its simplest form.
State the null hypothesis.
State the alternative hypothesis.
Write down the number of degrees of freedom for this test.
Calculate the expected number of teenagers that prefer cats.
State the conclusion for this test. Give a reason for your answer.
Markscheme
* This question is from an exam for a previous syllabus, and may contain minor differences in marking or structure.
140 (A1)
[1 mark]
1 (A1)
[1 mark]
2 (A1)
[1 mark]
1 (A1)
[1 mark]
3 (A1)
[1 mark]
17:15 OR (A1)
Note: Award (A0) for 85:75 or 1.13:1.
[1 mark]
preferred pet is independent of “whether or not the respondent was a teenager" or "age category” (A1)
Note: Accept there is no association between pet and age. Do not accept “not related” or “not correlated” or “influenced”.
[1 mark]
preferred pet is not independent of age (A1)(ft)
Note: Follow through from part (e)(i) i.e. award (A1)(ft) if their alternative hypothesis is the negation of their null hypothesis. Accept “associated” or “dependent”.
[1 mark]
3 (A1)
[1 mark]
OR (M1)
29.2 (29.2187…) (A1)(G2)
[2 marks]
0.208 > 0.1 (R1)
accept null hypothesis OR fail to reject null hypothesis (A1)(ft)
Note: Award (R1) for a correct comparison of their -value to the significance level, award (A1)(ft) for the correct result from that comparison. Accept “-value > 0.1” as part of the comparison but only if their -value is explicitly seen in part (h). Follow through from their answer to part (h). Do not award (R0)(A1).
[2 marks]
Examiners report
Sila High School has 110 students. They each take exactly one language class from a choice of English, Spanish or Chinese. The following table shows the number of female and male students in the three different language classes.

A test was carried out at the 5 % significance level to analyse the relationship between gender and student choice of language class.
Use your graphic display calculator to write down
The critical value at the 5 % significance level for this test is 5.99.
One student is chosen at random from this school.
Another student is chosen at random from this school.
Write down the null hypothesis, H0 , for this test.
State the number of degrees of freedom.
the expected frequency of female students who chose to take the Chinese class.
State whether or not H0 should be rejected. Justify your statement.
Find the probability that the student does not take the Spanish class.
Find the probability that neither of the two students take the Spanish class.
Find the probability that at least one of the two students is female.
Markscheme
* This question is from an exam for a previous syllabus, and may contain minor differences in marking or structure.
(H0:) (choice of) language is independent of gender (A1)
Note: Accept “there is no association between language (choice) and gender”. Accept “language (choice) is not dependent on gender”. Do not accept “not related” or “not correlated” or “not influenced”.
[1 mark]
2 (AG)
[1 mark]
16.4 (16.4181…) (G1)
[1 mark]
(we) reject the null hypothesis (A1)(ft)
8.68507… > 5.99 (R1)(ft)
Note: Follow through from part (c)(ii). Accept “do not accept” in place of “reject.” Do not award (A1)(ft)(R0).
OR
(we) reject the null hypothesis (A1)
0.0130034 < 0.05 (R1)
Note: Accept “do not accept” in place of “reject.” Do not award (A1)(ft)(R0).
[2 marks]
(A1)(A1)(G2)
Note: Award (A1) for correct numerator, (A1) for correct denominator.
[2 marks]
(M1)(M1)
Note: Award (M1) for multiplying two fractions. Award (M1) for multiplying their correct fractions.
OR
(M1)(M1)
Note: Award (M1) for correct products; (M1) for adding 4 products.
(A1)(ft)(G2)
Note: Follow through from their answer to part (e)(i).
[3 marks]
(M1)(M1)
Note: Award (M1) for multiplying two correct fractions. Award (M1) for subtracting their product of two fractions from 1.
OR
(M1)(M1)
Note: Award (M1) for correct products; (M1) for adding three products.
(A1)(G2)
[3 marks]
Examiners report
There are three fair six-sided dice. Each die has two green faces, two yellow faces and two red faces.
All three dice are rolled.
Ted plays a game using these dice. The rules are:
- Having a turn means to roll all three dice.
- He wins $10 for each green face rolled and adds this to his winnings.
- After a turn Ted can either:
- end the game (and keep his winnings), or
- have another turn (and try to increase his winnings).
- If two or more red faces are rolled in a turn, all winnings are lost and the game ends.
The random variable ($) represents how much is added to his winnings after a turn.
The following table shows the distribution for , where $ represents his winnings in the game so far.

Find the probability of rolling exactly one red face.
Find the probability of rolling two or more red faces.
Show that, after a turn, the probability that Ted adds exactly $10 to his winnings is .
Write down the value of .
Hence, find the value of .
Ted will always have another turn if he expects an increase to his winnings.
Find the least value of for which Ted should end the game instead of having another turn.
Markscheme
valid approach to find P(one red) (M1)
eg , , ,
listing all possible cases for exactly one red (may be indicated on tree diagram)
P(1 red) = 0.444 [0.444, 0.445] A1 N2
[3 marks] [5 maximum for parts (a.i) and (a.ii)]
valid approach (M1)
eg P() + P(), 1 − P( ≤ 1), binomcdf
correct working (A1)
eg , 0.222 + 0.037 ,
0.259259
P(at least two red) = 0.259 A1 N3
[3 marks] [5 maximum for parts (a.i) and (a.ii)]
recognition that winning $10 means rolling exactly one green (M1)
recognition that winning $10 also means rolling at most 1 red (M1)
eg “cannot have 2 or more reds”
correct approach A1
eg P(1G ∩ 0R) + P(1G ∩ 1R), P(1G) − P(1G ∩ 2R),
“one green and two yellows or one of each colour”
Note: Because this is a “show that” question, do not award this A1 for purely numerical expressions.
one correct probability for their approach (A1)
eg , , , ,
correct working leading to A1
eg , ,
probability = AG N0
[5 marks]
, 0.259 (check FT from (a)(ii)) A1 N1
[1 mark]
evidence of summing probabilities to 1 (M1)
eg , ,
0.148147 (0.148407 if working with their value to 3 sf)
(exact), 0.148 A1 N2
[2 marks]
correct substitution into the formula for expected value (A1)
eg
correct critical value (accept inequality) A1
eg = 34.2857 , > 34.2857
$40 A1 N2
[3 marks]
Examiners report
Don took part in a project investigating wind speed, , and the time, minutes, to fully charge a solar powered robot.
The investigation was carried out six times. The results are recorded in the table.

is the point with coordinates .
On graph paper, draw a scatter diagram to show the results of Don’s investigation. Use a scale of to represent units on the -axis, and to represent units on the -axis.
Calculate , the mean wind speed.
Calculate , the mean time to fully charge the robot.
Plot and label the point on your scatter diagram.
Calculate , Pearson’s product–moment correlation coefficient.
Describe the correlation between the wind speed and the time to fully charge the robot.
Write down the equation of the regression line on , in the form .
Draw this regression line on your scatter diagram.
Hence or otherwise estimate the charging time when the wind speed is .
Don concluded from his investigation: “There is no causation between wind speed and the time to fully charge the robot”.
In the context of the question, briefly explain the meaning of “no causation”.
Markscheme
* This question is from an exam for a previous syllabus, and may contain minor differences in marking or structure.
 (A4)
(A4)
Note: Award (A1) for correct scales and labels.
Award (A3) for all six points correctly plotted.
Award (A2) for four or five points correctly plotted.
Award (A1) for two or three points correctly plotted.
Award at most (A0)(A3) if axes reversed.
If graph paper is not used, award at most (A1)(A0)(A0)(A0).
[4 marks]
(A1)
[1 mark]
(minutes) (A1)
[1 mark]
point in correct position, labelled (A1)(ft)(A1)
Note: Award (A1)(ft) for point plotted in correct position, (A1) for point labelled Follow through from their part (b).
[2 marks]
(G2)
Note: Award (G1) for (incorrect rounding).
[2 marks]
(very) strong positive correlation (A1)(ft)(A1)(ft)
Note: Award (A1)(ft) for (very) strong. Award (A1)(ft) for positive. Follow though from their part (d)(i). If there is no answer to part (d)(i), award at most (A0)(A1) for a correct direction.
[2 marks]
(A1)(A1)(G2)
Note: Award (A1) for . Award (A1) for . If the answer is not an equation, award at most (A1)(A0).
[2 marks]
regression line through their (A1)(ft)
regression line through their (A1)(ft)
Note: Award a maximum of (A1)(A0) if the line is not straight/ruler not used. Award (A0)(A0) if the points are connected.
Follow through from their point in part (b) and their -intercept in part (e)(i).
If is not plotted or labelled, then follow through from part (b).
[2 marks]
(M1)
Note: Award (M1) for correct substitution into their regression equation.
(minutes) (A1)(ft)(G2)
Note: Follow through from their equation in part (e)(i).
OR
an attempt to use their regression line to find the value at
Note: Award (M1) for an indication of using their regression line. This must be illustrated by vertical and horizontal lines or marks at the correct place(s) on their scatter diagram.
(minutes) (A1)(ft)
Note: Follow through from part (e)(ii).
[2 marks]
wind speed does not cause a change in the time to charge (the robot) (A1)
Note: Award (A1) for a statement that communicates the meaning of a non-causal relationship between the two variables.
[1 mark]
Examiners report
It is known that the weights of male Persian cats are normally distributed with mean and variance .
A group of male Persian cats are drawn from this population.
Sketch a diagram showing the above information.
Find the proportion of male Persian cats weighing between and .
Determine the expected number of cats in this group that have a weight of less than .
It is found that of the cats weigh more than . Estimate the value of .
Ten of the cats are chosen at random. Find the probability that exactly one of them weighs over .
Markscheme
 A1A1
A1A1
Note: Award A1 for a normal curve with mean labelled or , A1 for indication of SD marks on horizontal axis at and/or OR and/or on the correct side and approximately correct position.
[2 marks]
OR labelled sketch of region (M1)
A1
[2 marks]
(A1)
(M1)
A1
[3 marks]
OR (A1)
OR OR labelled sketch of region (M1)
A1
[3 marks]
(A1)
recognition of binomial (M1)
e.g.
A2
[4 marks]
Examiners report
In a company it is found that 25 % of the employees encountered traffic on their way to work. From those who encountered traffic the probability of being late for work is 80 %.
From those who did not encounter traffic, the probability of being late for work is 15 %.
The tree diagram illustrates the information.

The company investigates the different means of transport used by their employees in the past year to travel to work. It was found that the three most common means of transport used to travel to work were public transportation (P ), car (C ) and bicycle (B ).
The company finds that 20 employees travelled by car, 28 travelled by bicycle and 19 travelled by public transportation in the last year.
Some of the information is shown in the Venn diagram.

There are 54 employees in the company.
Write down the value of a.
Write down the value of b.
Use the tree diagram to find the probability that an employee encountered traffic and was late for work.
Use the tree diagram to find the probability that an employee was late for work.
Use the tree diagram to find the probability that an employee encountered traffic given that they were late for work.
Find the value of x.
Find the value of y.
Find the number of employees who, in the last year, did not travel to work by car, bicycle or public transportation.
Find .
Markscheme
a = 0.2 (A1)
[1 mark]
b = 0.85 (A1)
[1 mark]
0.25 × 0.8 (M1)
Note: Award (M1) for a correct product.
(A1)(G2)
[2 marks]
0.25 × 0.8 + 0.75 × 0.15 (A1)(ft)(M1)
Note: Award (A1)(ft) for their (0.25 × 0.8) and (0.75 × 0.15), (M1) for adding two products.
(A1)(ft)(G3)
Note: Award the final (A1)(ft) only if answer does not exceed 1. Follow through from part (b)(i).
[3 marks]
(A1)(ft)(A1)(ft)
Note: Award (A1)(ft) for a correct numerator (their part (b)(i)), (A1)(ft) for a correct denominator (their part (b)(ii)). Follow through from parts (b)(i) and (b)(ii).
(A1)(ft)(G3)
Note: Award final (A1)(ft) only if answer does not exceed 1.
[3 marks]
(x =) 3 (A1)
[1 Mark]
(y =) 10 (A1)(ft)
Note: Following through from part (c)(i) but only if their x is less than or equal to 13.
[1 Mark]
54 − (10 + 3 + 4 + 2 + 6 + 8 + 13) (M1)
Note: Award (M1) for subtracting their correct sum from 54. Follow through from their part (c).
= 8 (A1)(ft)(G2)
Note: Award (A1)(ft) only if their sum does not exceed 54. Follow through from their part (c).
[2 marks]
6 + 8 + 13 (M1)
Note: Award (M1) for summing 6, 8 and 13.
27 (A1)(G2)
[2 marks]
Examiners report
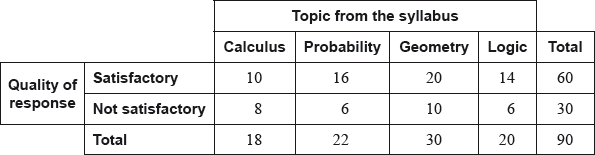
In a school, all Mathematical Studies SL students were given a test. The test contained four questions, each one on a different topic from the syllabus. The quality of each response was classified as satisfactory or not satisfactory. Each student answered only three of the four questions, each on a separate answer sheet.
The table below shows the number of satisfactory and not satisfactory responses for each question.
A test is carried out at the 5% significance level for the data in the table.
The critical value for this test is 7.815.
If the teacher chooses a response at random, find the probability that it is a response to the Calculus question;
If the teacher chooses a response at random, find the probability that it is a satisfactory response to the Calculus question;
If the teacher chooses a response at random, find the probability that it is a satisfactory response, given that it is a response to the Calculus question.
The teacher groups the responses by topic, and chooses two responses to the Logic question. Find the probability that both are not satisfactory.
State the null hypothesis for this test.
Show that the expected frequency of satisfactory Calculus responses is 12.
Write down the number of degrees of freedom for this test.
Use your graphic display calculator to find the statistic for this data.
State the conclusion of this test. Give a reason for your answer.
Markscheme
(A1)(A1)(G2)
Note: Award (A1) for correct numerator, (A1) for correct denominator.
[2 marks]
(A1)(A1)(G2)
Note: Award (A1) for correct numerator, (A1) for correct denominator.
[2 marks]
(A1)(A1)(G2)
Note: Award (A1) for correct numerator, (A1) for correct denominator.
[2 marks]
(A1)(M1)
Note: Award (A1) for two correct fractions seen, (M1) for multiplying their two fractions.
(A1)(G2)
[3 marks]
: quality (of response) and topic (from the syllabus) are independent (A1)
Note: Accept there is no association between quality (of response) and topic (from the syllabus). Do not accept “not related” or “not correlated” or “influenced”.
[1 mark]
OR (M1)
Note: Award (M1) for correct substitution in expected value formula.
(AG)
Note: The conclusion, , must be seen for the (A1) to be awarded.
[1 mark]
3 (A1)
[1 mark]
(G2)
[2 marks]
OR (R1)
the null hypothesis is not rejected (A1)(ft)
OR
the quality of the response and the topic are independent (A1)(ft)
Note: Award (R1) for a correct comparison of either their statistic to the critical value or the correct -value 0.690688… to the test level, award (A1)(ft) for the correct result from that comparison. Accept “” for the comparison, but only if their value is explicitly seen in part (f). Follow through from their answers to part (f) and part (c). Do not award (R0)(A1).
[2 marks]
Examiners report
Mackenzie conducted an experiment on the reaction times of teenagers. The results of the experiment are displayed in the following cumulative frequency graph.

Use the graph to estimate the
Mackenzie created the cumulative frequency graph using the following grouped frequency table.

Upon completion of the experiment, Mackenzie realized that some values were grouped incorrectly in the frequency table. Some reaction times recorded in the interval should have been recorded in the interval .
median reaction time.
interquartile range of the reaction times.
Find the estimated number of teenagers who have a reaction time greater than seconds.
Determine the percentile of the reaction times from the cumulative frequency graph.
Write down the value of .
Write down the value of .
Write down the modal class from the table.
Use your graphic display calculator to find an estimate of the mean reaction time.
Suggest how, if at all, the estimated mean and estimated median reaction times will change if the errors are corrected. Justify your response.
Markscheme
A1
[1 mark]
(A1)(M1)
Note: Award A1 for correct quartiles seen, M1 for subtraction of their quartiles.
A1
[3 marks]
(people have reaction time ) (A1)
(people have reaction time ) A1
[2 marks]
OR (A1)
A1
[2 marks]
A1
[1 mark]
A1
[1 mark]
A1
[1 mark]
A2
[2 marks]
the mean will increase A1
because the incorrect reaction times are moving from a lower interval to a higher interval which will increase the numerator of the mean calculation R1
the median will stay the same A1
because the median or middle of the data is greater than both intervals being changed R1
Note: Do not award A1R0.
[4 marks]
Examiners report
Most candidates were able to determine the median and interquartile range from the given graph. Some lost marks due to use of one significant figure values or because of incorrectly reading the quartiles as 0.75 and 0.25. Candidates were also able to find the estimated number of teenagers with reaction time greater than 0.4s in part (b), but determining the 90th percentile in part (c) proved to be more challenging. Most made a good attempt at completing the frequency table in part (d), but some used cumulative values from the graph incorrectly. Candidates who lost marks in part (d), were able to get “follow through” marks in parts (e) and (f). In part (e), most candidates were able to determine the modal class correctly. Not all candidates used the correct formula to find an estimate for the mean. Candidates who used their calculators usually obtained the correct answer. In part (g), few candidates were able to produce correct statements related to the changes of the mean and the median, and even fewer were able to support these statements with well-articulated reasons.
A pharmaceutical company has developed a new drug to decrease cholesterol. The final stage of testing the new drug is to compare it to their current drug. They have 150 volunteers, all recently diagnosed with high cholesterol, from which they want to select a sample of size 18. They require as close as possible 20% of the sample to be below the age of 30, 30% to be between the ages of 30 and 50 and 50% to be over the age of 50.
Half of the 18 volunteers are given the current drug and half are given the new drug. After six months each volunteer has their cholesterol level measured and the decrease during the six months is shown in the table.

Calculate the mean decrease in cholesterol for
The company uses a t-test, at the 1% significance level, to determine if the new drug is more effective at decreasing cholesterol.
State the name for this type of sampling technique.
Calculate the number of volunteers in the sample under the age of 30.
The new drug.
The current drug.
State an assumption that the company is making, in order to use a t-test.
State the hypotheses for this t-test.
Find the p-value for this t-test.
State the conclusion of this test, in context, giving a reason.
Markscheme
stratified sampling A1
[1 mark]
M1A1
so 4 volunteers need to be chosen A1
[3 marks]
34.8 mg/dL A1
[1 mark]
24.7 mg/dL A1
[1 mark]
EITHER
The decreases in cholesterol are distributed normally A1
OR
The variance of the two groups of volunteers is equal. A1
[1 mark]
and A1
where N and C represent the decreases of the new and current drug
[1 mark]
df = 16, t = 2.77 (M1)
p-value = 0.00683 A2
[3 marks]
Since 0.00683 < 0.01 R1
Reject H0. There is evidence, at the 1% level, that the new drug is more effective. A1
[2 marks]
Examiners report
The following table shows a probability distribution for the random variable , where .

A bag contains white and blue marbles, with at least three of each colour. Three marbles are drawn from the bag, without replacement. The number of blue marbles drawn is given by the random variable .
A game is played in which three marbles are drawn from the bag of ten marbles, without replacement. A player wins a prize if three white marbles are drawn.
Find .
Find .
Write down the probability of drawing three blue marbles.
Explain why the probability of drawing three white marbles is .
The bag contains a total of ten marbles of which are white. Find .
Grant plays the game until he wins two prizes. Find the probability that he wins his second prize on his eighth attempt.
Markscheme
correct substitution into formula (A1)
eg
, 0.0333 A1 N2
[2 marks]
evidence of summing probabilities to 1 (M1)
eg
A1 N2
[2 marks]
A1 N1
[1 mark]
valid reasoning R1
eg
AG N0
[1 mark]
valid method (M1)
eg
correct equation A1
eg
A1 N2
[3 marks]
recognizing one prize in first seven attempts (M1)
eg
correct working (A1)
eg
correct approach (A1)
eg
0.065119
0.0651 A1 N2
[4 marks]
Examiners report
Two events A and B are such that P(A) = 0.62 and P = 0.18.
Find P(A ∩ B′ ).
Given that P((A ∪ B)′ ) = 0.19, find P(A | B′ ).
Markscheme
* This question is from an exam for a previous syllabus, and may contain minor differences in marking or structure.
valid approach
eg Venn diagram, P(A) − P (A ∩ B), 0.62 − 0.18 (M1)
P(A ∩ B' ) = 0.44 A1 N2
[2 marks]
valid approach to find either P(B′ ) or P(B) (M1)
eg  (seen anywhere), 1 − P(A ∩ B′ ) − P((A ∪ B)′ )
correct calculation for P(B′ ) or P(B) (A1)
eg 0.44 + 0.19, 0.81 − 0.62 + 0.18
correct substitution into (A1)
eg
0.698412
P(A | B′ ) = (exact), 0.698 A1 N3
[4 marks]
Examiners report
The weight, W, of basketball players in a tournament is found to be normally distributed with a mean of 65 kg and a standard deviation of 5 kg.
The probability that a basketball player has a weight that is within 1.5 standard deviations of the mean is q.
A basketball coach observed 60 of her players to determine whether their performance and their weight were independent of each other. Her observations were recorded as shown in the table.

She decided to conduct a χ 2 test for independence at the 5% significance level.
Find the probability that a basketball player has a weight that is less than 61 kg.
In a training session there are 40 basketball players.
Find the expected number of players with a weight less than 61 kg in this training session.
Sketch a normal curve to represent this probability.
Find the value of q.
Given that P(W > k) = 0.225 , find the value of k.
For this test state the null hypothesis.
For this test find the p-value.
State a conclusion for this test. Justify your answer.
Markscheme
P(W < 61) (M1)
Note: Award (M1) for correct probability statement.
OR
 (M1)
(M1)
Note: Award (M1) for correct region labelled and shaded on diagram.
= 0.212 (0.21185…, 21.2%) (A1)(G2)
[2 marks]
40 × 0.21185… (M1)
Note: Award (M1) for product of 40 and their 0.212.
= 8.47 (8.47421...) (A1)(ft)(G2)
Note: Follow through from their part (a)(i) provided their answer to part (a)(i) is less than 1.
[2 marks]
 (A1)(M1)
Note: Award (A1) for two correctly labelled vertical lines in approximately correct positions. The values 57.5 and 72.5, or μ − 1.5σ and μ + 1.5σ are acceptable labels. Award (M1) for correctly shaded region marked by their two vertical lines.
[2 marks]
0.866 (0.86638…, 86.6%) (A1)(ft)
Note: Follow through from their part (b)(i) shaded region if their values are clear.
[1 mark]
P(W < k) = 0.775 (M1)
OR
 (M1)
(M1)
Note: Award (A1) for correct region labelled and shaded on diagram.
(k =) 68.8 (68.7770…) (A1)(G2)
[2 marks]
(H0:) performance (of players) and (their) weight are independent. (A1)
Note: Accept “there is no association between performance (of players) and (their) weight”. Do not accept "not related" or "not correlated" or "not influenced".
[1 mark]
0.287 (0.287436…) (G2)
[2 marks]
accept/ do not reject null hypothesis/H0 (A1)(ft)
OR
performance (of players) and (their) weight are independent. (A1)(ft)
0.287 > 0.05 (R1)(ft)
Note: Accept p-value>significance level provided their p-value is seen in b(ii). Accept 28.7% > 5%. Do not award (A1)(R0). Follow through from part (d).
[2 marks]
Examiners report
On one day 180 flights arrived at a particular airport. The distance travelled and the arrival status for each incoming flight was recorded. The flight was then classified as on time, slightly delayed, or heavily delayed.
The results are shown in the following table.

A χ2 test is carried out at the 10 % significance level to determine whether the arrival status of incoming flights is independent of the distance travelled.
The critical value for this test is 7.779.
A flight is chosen at random from the 180 recorded flights.
State the alternative hypothesis.
Calculate the expected frequency of flights travelling at most 500 km and arriving slightly delayed.
Write down the number of degrees of freedom.
Write down the χ2 statistic.
Write down the associated p-value.
State, with a reason, whether you would reject the null hypothesis.
Write down the probability that this flight arrived on time.
Given that this flight was not heavily delayed, find the probability that it travelled between 500 km and 5000 km.
Two flights are chosen at random from those which were slightly delayed.
Find the probability that each of these flights travelled at least 5000 km.
Markscheme
* This question is from an exam for a previous syllabus, and may contain minor differences in marking or structure.
The arrival status is dependent on the distance travelled by the incoming flight (A1)
Note: Accept “associated” or “not independent”.
[1 mark]
OR (M1)
Note: Award (M1) for correct substitution into expected value formula.
= 15 (A1) (G2)
[2 marks]
4 (A1)
Note: Award (A0) if “2 + 2 = 4” is seen.
[1 mark]
9.55 (9.54671…) (G2)
Note: Award (G1) for an answer of 9.54.
[2 marks]
0.0488 (0.0487961…) (G1)
[1 mark]
Reject the Null Hypothesis (A1)(ft)
Note: Follow through from their hypothesis in part (a).
9.55 (9.54671…) > 7.779 (R1)(ft)
OR
0.0488 (0.0487961…) < 0.1 (R1)(ft)
Note: Do not award (A1)(ft)(R0)(ft). Follow through from part (d). Award (R1)(ft) for a correct comparison, (A1)(ft) for a consistent conclusion with the answers to parts (a) and (d). Award (R1)(ft) for χ2calc > χ2crit , provided the calculated value is explicitly seen in part (d)(i).
[2 marks]
(A1)(A1) (G2)
Note: Award (A1) for correct numerator, (A1) for correct denominator.
[2 marks]
(A1)(A1) (G2)
Note: Award (A1) for correct numerator, (A1) for correct denominator.
[2 marks]
(A1)(M1)
Note: Award (A1) for two correct fractions and (M1) for multiplying their two fractions.
(A1) (G2)
[3 marks]
Examiners report
A transportation company owns 30 buses. The distance that each bus has travelled since being purchased by the company is recorded. The cumulative frequency curve for these data is shown.

It is known that 8 buses travelled more than m kilometres.
Find the number of buses that travelled a distance between 15000 and 20000 kilometres.
Use the cumulative frequency curve to find the median distance.
Use the cumulative frequency curve to find the lower quartile.
Use the cumulative frequency curve to find the upper quartile.
Hence write down the interquartile range.
Write down the percentage of buses that travelled a distance greater than the upper quartile.
Find the number of buses that travelled a distance less than or equal to 12 000 km.
Find the value of m.
The smallest distance travelled by one of the buses was 2500 km.
The longest distance travelled by one of the buses was 23 000 km.
On graph paper, draw a box-and-whisker diagram for these data. Use a scale of 2 cm to represent 5000 km.
Markscheme
* This question is from an exam for a previous syllabus, and may contain minor differences in marking or structure.
28 − 20 (A1)
Note: Award (A1) for 28 and 20 seen.
8 (A1)(G2)
[2 marks]
13500 (G2)
Note: Accept an answer in the range 13500 to 13750.
[2 marks]
10000 (G1)
Note: Accept an answer in the range 10000 to 10250.
[1 mark]
16000 (G1)
Note: Accept an answer in the range 16000 to 16250.
[1 mark]
6000 (A1)(ft)
Note: Follow through from their part (b)(ii) and (iii).
[1 mark]
25% (A1)
[1 mark]
11 (G1)
[1 mark]
30 − 8 OR 22 (M1)
Note: Award (M1) for subtracting 30 − 8 or 22 seen.
15750 (A1)(G2)
Note: Accept 15750 ± 250.
[2 marks]
 (A1)(A1)(A1)(A1)
Note: Award (A1) for correct label and scale; accept “distance” or “km” for label.
(A1)(ft) for correct median,
(A1)(ft) for correct quartiles and box,
(A1) for endpoints at 2500 and 23 000 joined to box by straight lines.
Accept ±250 for the median, quartiles and endpoints.
Follow through from their part (b).
The final (A1) is not awarded if the line goes through the box.
[4 marks]
Examiners report
A discrete random variable has the following probability distribution.

Find the value of .
Write down .
Find .
Markscheme
* This question is from an exam for a previous syllabus, and may contain minor differences in marking or structure.
valid approach (M1)
egtotal probability = 1
correct equation (A1)
eg
A2 N3
[4 marks]
A1 N1
[1 mark]
valid approach for finding (M1)
eg
correct substitution into formula for conditional probability (A1)
eg
0.0476190
(exact), 0.0476 A1 N2
[3 marks]
Examiners report
The scores of the eight highest scoring countries in the Eurovision song contest are shown in the following table.

For this data, find
Chester is investigating the relationship between the highest-scoring countries’ Eurovision score and their population size to determine whether population size can reasonably be used to predict a country’s score.
The populations of the countries, to the nearest million, are shown in the table.

Chester finds that, for this data, the Pearson’s product moment correlation coefficient is .
Chester then decides to find the Spearman’s rank correlation coefficient for this data, and creates a table of ranks.

Write down the value of:
the upper quartile.
the interquartile range.
Determine if the Netherlands’ score is an outlier for this data. Justify your answer.
State whether it would be appropriate for Chester to use the equation of a regression line for on to predict a country’s Eurovision score. Justify your answer.
.
.
.
Find the value of the Spearman’s rank correlation coefficient .
Interpret the value obtained for .
When calculating the ranks, Chester incorrectly read the Netherlands’ score as . Explain why the value of the Spearman’s rank correlation does not change despite this error.
Markscheme
(M1)
Note: This (M1) can also be awarded for either a correct or a correct in part (a)(ii).
A1
[2 marks]
their part (a)(i) – their (clearly stated) (M1)
IQR A1
[2 marks]
((IQR) ) (M1)
since R1
Netherlands is not an outlier A1
Note: The R1 is dependent on the (M1). Do not award R0A1.
[3 marks]
not appropriate (“no” is sufficient) A1
as is too close to zero / too weak a correlation R1
[2 marks]
A1
[1 mark]
A1
[1 mark]
A1
[1 mark]
A2
[2 marks]
EITHER
there is a (positive) association between the population size and the score A1
OR
there is a (positive) linear correlation between the ranks of the population size and the ranks of the scores (when compared with the PMCC of ). A1
[1 mark]
lowering the top score by does not change its rank so is unchanged R1
Note: Accept “this would not alter the rank” or “Netherlands still top rank” or similar. Condone any statement that clearly implies the ranks have not changed, for example: “The Netherlands still has the highest score.”
[1 mark]
Examiners report
In part (a), many candidates could use their GDC to find the upper quartile, but many forgot how to find the inter-quartile range.
In part (b), very few candidates knew how to show if a score is an outlier. Many candidates did not know that there is a mathematical definition to “outlier” and simply wrote sentences explaining why or why not a value was an outlier.
In part (c), candidates were able to assess the validity of a regression line. The justifications for their conclusion revealed a partial or imprecise understanding of the topic. Examples of this include “no correlation”, “weak value of ”, “low relationship”, “not close to 1”.
In part (d), about half of the candidates managed to find the correct values missing from the table.
In part (e), many candidates knew how to use their GDC to find Spearman’s rank correlation coefficient. Some mistakenly wrote down the value for instead of . Very few candidates could correctly interpret the value for as they became confused by the fact that linear correlation must go with the rank, otherwise it is about association. They could either have said “there is an association between population size and score” or “there is a linear correlation between the rank order of the population size and the ranks of the scores”.
In part (f), most candidates were able to work out that, even if the score changed, the rank remained the same.
All lengths in this question are in metres.
Consider the function , for −2 ≤ ≤ 2. In the following diagram, the shaded region is enclosed by the graph of and the -axis.

A container can be modelled by rotating this region by 360˚ about the -axis.
Water can flow in and out of the container.
The volume of water in the container is given by the function , for 0 ≤ ≤ 4 , where is measured in hours and is measured in m3. The rate of change of the volume of water in the container is given by .
The volume of water in the container is increasing only when < < .
Find the volume of the container.
Find the value of and of .
During the interval < < , he volume of water in the container increases by m3. Find the value of .
When = 0, the volume of water in the container is 2.3 m3. It is known that the container is never completely full of water during the 4 hour period.
Find the minimum volume of empty space in the container during the 4 hour period.
Markscheme
* This question is from an exam for a previous syllabus, and may contain minor differences in marking or structure.
attempt to substitute correct limits or the function into formula involving (M1)
eg ,
4.18879
volume = 4.19, (exact) (m3) A2 N3
Note: If candidates have their GDC incorrectly set in degrees, award M marks where appropriate, but no A marks may be awarded. Answers from degrees are p = 13.1243 and q = 26.9768 in (b)(i) and 12.3130 or 28.3505 in (b)(ii).
[3 marks]
recognizing the volume increases when is positive (M1)
eg > 0, sketch of graph of indicating correct interval
1.73387, 3.56393
= 1.73, = 3.56 A1A1 N3
[3 marks]
valid approach to find change in volume (M1)
eg ,
3.74541
total amount = 3.75 (m3) A2 N3
[3 marks]
Note: There may be slight differences in the final answer, depending on which values candidates carry through from previous parts. Accept answers that are consistent with correct working.
recognizing when the volume of water is a maximum (M1)
eg maximum when ,
valid approach to find maximum volume of water (M1)
eg , , 3.85745
correct expression for the difference between volume of container and maximum value (A1)
eg , 4.19 − 3.85745
0.331334
0.331 (m3) A2 N3
[5 marks]
Examiners report
Let . The following diagram shows part of the graph of .

There are -intercepts at and at . There is a maximum at A where , and a point of inflexion at B where .
Find the value of .
Write down the coordinates of A.
Write down the rate of change of at A.
Find the coordinates of B.
Find the the rate of change of at B.
Let be the region enclosed by the graph of , the -axis, the line and the line . The region is rotated 360° about the -axis. Find the volume of the solid formed.
Markscheme
* This question is from an exam for a previous syllabus, and may contain minor differences in marking or structure.
evidence of valid approach (M1)
eg
2.73205
A1 N2
[2 marks]
1.87938, 8.11721
A2 N2
[2 marks]
rate of change is 0 (do not accept decimals) A1 N1
[1 marks]
METHOD 1 (using GDC)
valid approach M1
eg, max/min on
sketch of either or , with max/min or root (respectively) (A1)
A1 N1
Substituting their value into (M1)
eg
A1 N1
METHOD 2 (analytical)
A1
setting (M1)
A1 N1
substituting their value into (M1)
eg
A1 N1
[4 marks]
recognizing rate of change is (M1)
eg
rate of change is 6 A1 N2
[3 marks]
attempt to substitute either limits or the function into formula (M1)
involving (accept absence of and/or )
eg
128.890
A2 N3
[3 marks]
Examiners report
The marks obtained by nine Mathematical Studies SL students in their projects (x) and their final IB examination scores (y) were recorded. These data were used to determine whether the project mark is a good predictor of the examination score. The results are shown in the table.

The equation of the regression line y on x is y = mx + c.
A tenth student, Jerome, obtained a project mark of 17.
Use your graphic display calculator to write down , the mean examination score.
Use your graphic display calculator to write down r , Pearson’s product–moment correlation coefficient.
Find the exact value of m and of c for these data.
Use the regression line y on x to estimate Jerome’s examination score.
Justify whether it is valid to use the regression line y on x to estimate Jerome’s examination score.
Markscheme
54 (G1)
[1 mark]
0.5 (G2)
[2 marks]
m = 0.875, c = 41.75 (A1)(A1)
Note: Award (A1) for 0.875 seen. Award (A1) for 41.75 seen. If 41.75 is rounded to 41.8 do not award (A1).
[2 marks]
y = 0.875(17) + 41.75 (M1)
Note: Award (M1) for correct substitution into their regression line.
= 56.6 (56.625) (A1)(ft)(G2)
Note: Follow through from part (b)(i).
[2 marks]
the estimate is valid (A1)
since this is interpolation and the correlation coefficient is large enough (R1)
OR
the estimate is not valid (A1)
since the correlation coefficient is not large enough (R1)
Note: Do not award (A1)(R0). The (R1) may be awarded for reasoning based on strength of correlation, but do not accept “correlation coefficient is not strong enough” or “correlation is not large enough”.
Award (A0)(R0) for this method if no numerical answer to part (a)(iii) is seen.
[2 marks]
Examiners report
A group of students were asked which electronic device they preferred. The results per age group are given in the following table.

A student from the group is chosen at random. Calculate the probability that the student
A test for independence was performed on the collected data at the significance level. The critical value for the test is .
prefers a tablet.
is years old and prefers a mobile phone.
prefers a laptop given that they are years old.
prefers a tablet or is years old.
State the null and alternative hypotheses.
Write down the number of degrees of freedom.
Write down the test statistic.
Write down the -value.
State the conclusion for the test in context. Give a reason for your answer.
Markscheme
A1A1
Note: Award A1 for correct numerator, A1 for correct denominator.
[2 marks]
A1A1
Note: Award A1 for correct numerator, A1 for correct denominator.
[2 marks]
A1A1
Note: Award A1 for correct numerator, A1 for correct denominator.
[2 marks]
OR (M1)
A1A1
Note: Award A1 for correct denominator seen, (M1) for correct calculation of the numerator, A1 for the correct answer.
[3 marks]
the variables are independent
the variables are dependent A1
Note: Award A1 for for both hypotheses correct. Do not accept “not correlated” or “not related” in place of “independent”.
[1 mark]
A1
[1 mark]
A2
[2 marks]
OR A1
[1 mark]
EITHER
R1
OR
R1
THEN
(there is sufficient evidence to accept that) preferred device and age group are not independent A1
Note: For the final A1 the answer must be in context. Do not award A1R0.
[2 marks]
Examiners report
A common error was to treat these as compound probability events. Candidates who attempted to use the conditional probability formula in part (a)(iii) often accrued at least one mark for a correct method. Some lost one mark for not reducing the total sample space. In part (a)(iv) many found , failing to subtract the intersection of the two events. When stating test hypotheses, terminology such as "related", "correlated", "data is independent" are not acceptable. Few candidates attempted to frame this as a Goodness of Fit test. Candidates correctly wrote down the degrees of freedom. It was pleasing to see most found the correct -test statistic and associated p-value. Relative to past examination sessions, fewer candidates appeared to compare the critical value with the p-value or the -test statistic with the level of significance. A conclusion consistent with their hypotheses was usually seen, though this was not always expressed in context.
A common error was to treat these as compound probability events. Candidates who attempted to use the conditional probability formula in part (a)(iii) often accrued at least one mark for a correct method. Some lost one mark for not reducing the total sample space. In part (a)(iv) many found , failing to subtract the intersection of the two events. When stating test hypotheses, terminology such as "related", "correlated", "data is independent" are not acceptable. Few candidates attempted to frame this as a Goodness of Fit test. Candidates correctly wrote down the degrees of freedom. It was pleasing to see most found the correct -test statistic and associated p-value. Relative to past examination sessions, fewer candidates appeared to compare the critical value with the p-value or the -test statistic with the level of significance. A conclusion consistent with their hypotheses was usually seen, though this was not always expressed in context.
A common error was to treat these as compound probability events. Candidates who attempted to use the conditional probability formula in part (a)(iii) often accrued at least one mark for a correct method. Some lost one mark for not reducing the total sample space. In part (a)(iv) many found , failing to subtract the intersection of the two events. When stating test hypotheses, terminology such as "related", "correlated", "data is independent" are not acceptable. Few candidates attempted to frame this as a Goodness of Fit test. Candidates correctly wrote down the degrees of freedom. It was pleasing to see most found the correct -test statistic and associated p-value. Relative to past examination sessions, fewer candidates appeared to compare the critical value with the p-value or the -test statistic with the level of significance. A conclusion consistent with their hypotheses was usually seen, though this was not always expressed in context.
A common error was to treat these as compound probability events. Candidates who attempted to use the conditional probability formula in part (a)(iii) often accrued at least one mark for a correct method. Some lost one mark for not reducing the total sample space. In part (a)(iv) many found , failing to subtract the intersection of the two events. When stating test hypotheses, terminology such as "related", "correlated", "data is independent" are not acceptable. Few candidates attempted to frame this as a Goodness of Fit test. Candidates correctly wrote down the degrees of freedom. It was pleasing to see most found the correct -test statistic and associated p-value. Relative to past examination sessions, fewer candidates appeared to compare the critical value with the p-value or the -test statistic with the level of significance. A conclusion consistent with their hypotheses was usually seen, though this was not always expressed in context.
A common error was to treat these as compound probability events. Candidates who attempted to use the conditional probability formula in part (a)(iii) often accrued at least one mark for a correct method. Some lost one mark for not reducing the total sample space. In part (a)(iv) many found , failing to subtract the intersection of the two events. When stating test hypotheses, terminology such as "related", "correlated", "data is independent" are not acceptable. Few candidates attempted to frame this as a Goodness of Fit test. Candidates correctly wrote down the degrees of freedom. It was pleasing to see most found the correct -test statistic and associated p-value. Relative to past examination sessions, fewer candidates appeared to compare the critical value with the p-value or the -test statistic with the level of significance. A conclusion consistent with their hypotheses was usually seen, though this was not always expressed in context.
A common error was to treat these as compound probability events. Candidates who attempted to use the conditional probability formula in part (a)(iii) often accrued at least one mark for a correct method. Some lost one mark for not reducing the total sample space. In part (a)(iv) many found , failing to subtract the intersection of the two events. When stating test hypotheses, terminology such as "related", "correlated", "data is independent" are not acceptable. Few candidates attempted to frame this as a Goodness of Fit test. Candidates correctly wrote down the degrees of freedom. It was pleasing to see most found the correct -test statistic and associated p-value. Relative to past examination sessions, fewer candidates appeared to compare the critical value with the p-value or the -test statistic with the level of significance. A conclusion consistent with their hypotheses was usually seen, though this was not always expressed in context.
A common error was to treat these as compound probability events. Candidates who attempted to use the conditional probability formula in part (a)(iii) often accrued at least one mark for a correct method. Some lost one mark for not reducing the total sample space. In part (a)(iv) many found , failing to subtract the intersection of the two events. When stating test hypotheses, terminology such as "related", "correlated", "data is independent" are not acceptable. Few candidates attempted to frame this as a Goodness of Fit test. Candidates correctly wrote down the degrees of freedom. It was pleasing to see most found the correct -test statistic and associated p-value. Relative to past examination sessions, fewer candidates appeared to compare the critical value with the p-value or the -test statistic with the level of significance. A conclusion consistent with their hypotheses was usually seen, though this was not always expressed in context.
A common error was to treat these as compound probability events. Candidates who attempted to use the conditional probability formula in part (a)(iii) often accrued at least one mark for a correct method. Some lost one mark for not reducing the total sample space. In part (a)(iv) many found , failing to subtract the intersection of the two events. When stating test hypotheses, terminology such as "related", "correlated", "data is independent" are not acceptable. Few candidates attempted to frame this as a Goodness of Fit test. Candidates correctly wrote down the degrees of freedom. It was pleasing to see most found the correct -test statistic and associated p-value. Relative to past examination sessions, fewer candidates appeared to compare the critical value with the p-value or the -test statistic with the level of significance. A conclusion consistent with their hypotheses was usually seen, though this was not always expressed in context.
A common error was to treat these as compound probability events. Candidates who attempted to use the conditional probability formula in part (a)(iii) often accrued at least one mark for a correct method. Some lost one mark for not reducing the total sample space. In part (a)(iv) many found , failing to subtract the intersection of the two events. When stating test hypotheses, terminology such as "related", "correlated", "data is independent" are not acceptable. Few candidates attempted to frame this as a Goodness of Fit test. Candidates correctly wrote down the degrees of freedom. It was pleasing to see most found the correct -test statistic and associated p-value. Relative to past examination sessions, fewer candidates appeared to compare the critical value with the p-value or the -test statistic with the level of significance. A conclusion consistent with their hypotheses was usually seen, though this was not always expressed in context.
160 students attend a dual language school in which the students are taught only in Spanish or taught only in English.
A survey was conducted in order to analyse the number of students studying Biology or Mathematics. The results are shown in the Venn diagram.
Set S represents those students who are taught in Spanish.
Set B represents those students who study Biology.
Set M represents those students who study Mathematics.

A student from the school is chosen at random.
Find the number of students in the school that are taught in Spanish.
Find the number of students in the school that study Mathematics in English.
Find the number of students in the school that study both Biology and Mathematics.
Write down .
Write down .
Find the probability that this student studies Mathematics.
Find the probability that this student studies neither Biology nor Mathematics.
Find the probability that this student is taught in Spanish, given that the student studies Biology.
Markscheme
10 + 40 + 28 + 17 (M1)
= 95 (A1)(G2)
Note: Award (M1) for each correct sum (for example: 10 + 40 + 28 + 17) seen.
[2 marks]
20 + 12 (M1)
= 32 (A1)(G2)
Note: Award (M1) for each correct sum (for example: 10 + 40 + 28 + 17) seen.
[2 marks]
12 + 40 (M1)
= 52 (A1)(G2)
Note: Award (M1) for each correct sum (for example: 10 + 40 + 28 + 17) seen.
[2 marks]
78 (A1)
[1 mark]
12 (A1)
[1 mark]
(A1)(A1) (G2)
Note: Throughout part (c), award (A1) for correct numerator, (A1) for correct denominator. All answers must be probabilities to award (A1).
[2 marks]
(A1)(A1) (G2)
Note: Throughout part (c), award (A1) for correct numerator, (A1) for correct denominator. All answers must be probabilities to award (A1).
[2 marks]
(A1)(A1) (G2)
Note: Throughout part (c), award (A1) for correct numerator, (A1) for correct denominator. All answers must be probabilities to award (A1).
[2 marks]
Examiners report
On a school excursion, students visited an amusement park. The amusement park’s main attractions are rollercoasters (), water slides (), and virtual reality rides ().
The students were asked which main attractions they visited. The results are shown in the Venn diagram.

A total of students visited the rollercoasters or the water slides.
Find the value of .
Find the value of .
Find the number of students who visited at least two types of main attraction.
Write down the value of .
Find the probability that a randomly selected student visited the rollercoasters.
Find the probability that a randomly selected student visited the virtual reality rides.
Hence determine whether the events in parts (d)(i) and (d)(ii) are independent. Justify your reasoning.
Markscheme
OR (M1)
Note: Award (M1) for setting up a correct expression.
(A1)(G2)
[2 marks]
(M1)
OR
(M1)
OR
(M1)
Note: Award (M1) for setting up a correct expression. Follow through from part (a)(i) but only for .
(A1)(ft)(G2)
Note: Follow through from part(a)(i). The value of must be greater or equal to zero for the (A1)(ft) to be awarded.
[2 marks]
(M1)
Note: Award (M1) for adding and .
(A1)(G2)
[2 marks]
(A1)
[1 mark]
(A1)(A1)(G2)
Note: Award (A1) for correct numerator. Award(A1) for the correct denominator. Award (A0) for only.
[2 marks]
(A1)(ft)
Note: Follow through from their denominator from part (d)(i).
[1 mark]
they are not independent (A1)(ft)
OR (R1)
Note: Comparison of numerical values must be seen for (R1) to be awarded.
Do not award (A1)(R0). Follow through from parts (d)(i) and (d)(ii).
[2 marks]
Examiners report
The following table shows the hand lengths and the heights of five athletes on a sports team.

The relationship between x and y can be modelled by the regression line with equation y = ax + b.
Another athlete on this sports team has a hand length of 21.5 cm. Use the regression equation to estimate the height of this athlete.
Markscheme
substituting x = 21.5 into their equation (M1)
eg 9.91(21.5) − 31.3
181.755
182 (cm) A1 N2
[2 marks]
Examiners report
The table below shows the distribution of test grades for 50 IB students at Greendale School.

A student is chosen at random from these 50 students.
A second student is chosen at random from these 50 students.
The number of minutes that the 50 students spent preparing for the test was normally distributed with a mean of 105 minutes and a standard deviation of 20 minutes.
Calculate the mean test grade of the students;
Calculate the standard deviation.
Find the median test grade of the students.
Find the interquartile range.
Find the probability that this student scored a grade 5 or higher.
Given that the first student chosen at random scored a grade 5 or higher, find the probability that both students scored a grade 6.
Calculate the probability that a student chosen at random spent at least 90 minutes preparing for the test.
Calculate the expected number of students that spent at least 90 minutes preparing for the test.
Markscheme
(M1)
Note: Award (M1) for correct substitution into mean formula.
(A1) (G2)
[2 marks]
(G1)
[1 mark]
5 (A1)
[1 mark]
(M1)
Note: Award (M1) for 6 and 4 seen.
(A1) (G2)
[2 marks]
(M1)
Note: Award (M1) for seen.
(A1) (G2)
[2 marks]
(M1)(M1)
Note: Award (M1) for seen, (M1) for multiplying their first probability by .
OR
Note: Award (M1) for seen, (M1) for dividing their first probability by .
(A1)(ft) (G3)
Note: Follow through from part (d).
[3 marks]
(M1)
OR
 (M1)
(M1)
Note: Award (M1) for a diagram showing the correct shaded region .
(A1) (G2)
[2 marks]
(M1)
(A1)(ft) (G2)
Note: Follow through from part (f)(i).
[2 marks]
Examiners report
A dice manufacturer claims that for a novelty die he produces the probability of scoring the numbers to are all equal, and the probability of a is two times the probability of scoring any of the other numbers.
To test the manufacture’s claim one of the novelty dice is rolled times and the numbers scored on the die are shown in the table below.

A goodness of fit test is to be used with a significance level.
Find the probability of scoring a six when rolling the novelty die.
Find the probability of scoring more than sixes when this die is rolled times.
Find the expected frequency for each of the numbers if the manufacturer’s claim is true.
Write down the null and alternative hypotheses.
State the degrees of freedom for the test.
Determine the conclusion of the test, clearly justifying your answer.
Markscheme
* This sample question was produced by experienced DP mathematics senior examiners to aid teachers in preparing for external assessment in the new MAA course. There may be minor differences in formatting compared to formal exam papers.
Let the probability of scoring be
(M1)(A1)
Probability of A1
[3 marks]
Let the number of sixes be
(M1)
or (M1)
(M1)A1
[4 marks]
Expected frequency is or (M1)
 A1
A1
[2 marks]
The manufacture’s claim is correct A1
The manufacturer’s claim is not correct A1
[2 marks]
Degrees of freedom A1
[1 mark]
p-value (M1)A1
R1
Hence insufficient evidence to reject the manufacture’s claim. A1
[4 marks]
Examiners report
The stopping distances for bicycles travelling at are assumed to follow a normal distribution with mean and standard deviation .
Under this assumption, find, correct to four decimal places, the probability that a bicycle chosen at random travelling at manages to stop
randomly selected bicycles are tested and their stopping distances when travelling at are measured.
Find, correct to four significant figures, the expected number of bicycles tested that stop between
The measured stopping distances of the bicycles are given in the table.

It is decided to perform a goodness of fit test at the level of significance to decide whether the stopping distances of bicycles travelling at can be modelled by a normal distribution with mean and standard deviation .
in less than .
in more than .
and .
and .
State the null and alternative hypotheses.
Find the -value for the test.
State the conclusion of the test. Give a reason for your answer.
Markscheme
evidence of correct probability (M1)
e.g sketch OR correct probability statement,
A1
[2 marks]
A1
Note: Answers should be given to decimal place.
[1 mark]
multiplying their probability by (M1)
A1
[2 marks]
A1
Note: Answers should be given to 4 sf.
[1 mark]
stopping distances can be modelled by
stopping distances cannot be modelled by A1A1
Note: Award A1 for correct , including reference to the mean and standard deviation. Award A1 for the negation of their .
[2 marks]
or seen (M1)
A2
[3 marks]
R1
there is insufficient evidence to reject (or “accept ”) A1
Note: Do not award R0A1.
[2 marks]
Examiners report
The maximum temperature , in degrees Celsius, in a park on six randomly selected days is shown in the following table. The table also shows the number of visitors, , to the park on each of those six days.

The relationship between the variables can be modelled by the regression equation .
Find the value of and of .
Write down the value of .
Use the regression equation to estimate the number of visitors on a day when the maximum temperature is 15 °C.
Markscheme
evidence of set up (M1)
egcorrect value for or
0.667315, 22.2117
A1A1 N3
[3 marks]
0.922958
A1 N1
[1 marks]
valid approach (M1)
eg
32.2214 (A1)
32 (visitors) (must be an integer) A1 N2
[3 marks]
Examiners report
A water container is made in the shape of a cylinder with internal height cm and internal base radius cm.

The water container has no top. The inner surfaces of the container are to be coated with a water-resistant material.
The volume of the water container is .
The water container is designed so that the area to be coated is minimized.
One can of water-resistant material coats a surface area of .
Write down a formula for , the surface area to be coated.
Express this volume in .
Write down, in terms of and , an equation for the volume of this water container.
Show that .
Find .
Using your answer to part (e), find the value of which minimizes .
Find the value of this minimum area.
Find the least number of cans of water-resistant material that will coat the area in part (g).
Markscheme
* This question is from an exam for a previous syllabus, and may contain minor differences in marking or structure.
(A1)(A1)
Note: Award (A1) for either OR seen. Award (A1) for two correct terms added together.
[2 marks]
(A1)
Notes: Units not required.
[1 mark]
(A1)(ft)
Notes: Award (A1)(ft) for equating to their part (b).
Do not accept unless is explicitly defined as their part (b).
[1 mark]
(A1)(ft)(M1)
Note: Award (A1)(ft) for their seen.
Award (M1) for correctly substituting only into a correct part (a).
Award (A1)(ft)(M1) for rearranging part (c) to and substituting for in expression for .
(AG)
Notes: The conclusion, , must be consistent with their working seen for the (A1) to be awarded.
Accept as equivalent to .
[2 marks]
(A1)(A1)(A1)
Note: Award (A1) for , (A1) for or , (A1) for .
[3 marks]
(M1)
Note: Award (M1) for equating their part (e) to zero.
OR (M1)
Note: Award (M1) for isolating .
OR
sketch of derivative function (M1)
with its zero indicated (M1)
(A1)(ft)(G2)
[3 marks]
(M1)
Note: Award (M1) for correct substitution of their part (f) into the given equation.
(A1)(ft)(G2)
[2 marks]
(M1)
Note: Award (M1) for dividing their part (g) by 2000.
(A1)(ft)
Notes: Follow through from part (g).
14 (cans) (A1)(ft)(G3)
Notes: Final (A1) awarded for rounding up their to the next integer.
[3 marks]
Examiners report
A group of 66 people went on holiday to Hawaii. During their stay, three trips were arranged: a boat trip (), a coach trip () and a helicopter trip ().
From this group of people:
| 3 | went on all three trips; |
| 16 | went on the coach trip only; |
| 13 | went on the boat trip only; |
| 5 | went on the helicopter trip only; |
| x | went on the coach trip and the helicopter trip but not the boat trip; |
| 2x | went on the boat trip and the helicopter trip but not the coach trip; |
| 4x | went on the boat trip and the coach trip but not the helicopter trip; |
| 8 | did not go on any of the trips. |
One person in the group is selected at random.
Draw a Venn diagram to represent the given information, using sets labelled , and .
Show that .
Write down the value of .
Find the probability that this person
(i) went on at most one trip;
(ii) went on the coach trip, given that this person also went on both the helicopter trip and the boat trip.
Markscheme
* This question is from an exam for a previous syllabus, and may contain minor differences in marking or structure.
 (A5)
(A5)
Notes: Award (A1) for rectangle and three labelled intersecting circles (U need not be seen),
(A1) for 3 in the correct region,
(A1) for 8 in the correct region,
(A1) for 5, 13 and 16 in the correct regions,
(A1) for , and in the correct regions.
[5 marks]
(M1)
Note: Award (M1) for either a completely correct equation or adding all the terms from their diagram in part (a) and equating to 66.
Award (M0)(A0) if their equation has no .
OR (A1)
Note: Award (A1) for adding their like terms correctly, but only when the solution to their equation is equal to 3 and is consistent with their original equation.
(AG)
Note: The conclusion must be seen for the (A1) to be awarded.
[2 marks]
15 (A1)(ft)
Note: Follow through from part (a). The answer must be an integer.
[1 mark]
(i) (A1)(ft)(A1)(G2)
Note: Award (A1)(ft) for numerator, (A1) for denominator. Follow through from their Venn diagram.
(ii) (A1)(A1)(ft)(G2)
Note: Award (A1) for numerator, (A1)(ft) for denominator. Follow through from their Venn diagram.
[4 marks]
Examiners report
As part of his mathematics exploration about classic books, Jason investigated the time taken by students in his school to read the book The Old Man and the Sea. He collected his data by stopping and asking students in the school corridor, until he reached his target of students from each of the literature classes in his school.
Jason constructed the following box and whisker diagram to show the number of hours students in the sample took to read this book.

Mackenzie, a member of the sample, took hours to read the novel. Jason believes Mackenzie’s time is not an outlier.
For each student interviewed, Jason recorded the time taken to read The Old Man and the Sea , measured in hours, and paired this with their percentage score on the final exam . These data are represented on the scatter diagram.

Jason correctly calculates the equation of the regression line on for these students to be
.
He uses the equation to estimate the percentage score on the final exam for a student who read the book in hours.
Jason found a website that rated the ‘top ’ classic books. He randomly chose eight of these classic books and recorded the number of pages. For example, Book is rated and has pages. These data are shown in the table.

Jason intends to analyse the data using Spearman’s rank correlation coefficient, .
State which of the two sampling methods, systematic or quota, Jason has used.
Write down the median time to read the book.
Calculate the interquartile range.
Determine whether Jason is correct. Support your reasoning.
Describe the correlation.
Find the percentage score calculated by Jason.
State whether it is valid to use the regression line on for Jason’s estimate. Give a reason for your answer.
Copy and complete the information in the following table.

Calculate the value of .
Interpret your result.
Markscheme
Quota sampling A1
[1 mark]
(hours) A1
[1 mark]
(M1)
Note: Award M1 for and seen.
A1
[2 marks]
indication of a valid attempt to find the upper fence (M1)
A1
(accept equivalent answer in words) R1
Jason is correct A1
Note: Do not award R0A1. Follow through within this part from their , but only if their value is supported by a valid attempt or clearly and correctly explains what their value represents.
[4 marks]
“negative” seen A1
Note: Strength cannot be inferred visually; ignore “strong” or “weak”.
[1 mark]
correct substitution (M1)
A1
[2 marks]
not reliable A1
extrapolation OR outside the given range of the data R1
Note: Do not award A1R0. Only accept reasoning that includes reference to the range of the data. Do not accept a contextual reason such as hours is too short to read the book.
[2 marks]
 A1A1
A1A1
Note: Do not award A1 for correct ranks for ‘number of pages’. Award A1 for correct ranks for ‘top 50 rating’.
[2 marks]
A2
Note: FT from their table.
[2 marks]
EITHER
there is a (strong/moderate) positive association between the number of pages and the top rating. A1
OR
there is a (strong/moderate) agreement between the rank order of number of pages and the rank order top rating. A1
OR
there is a (strong/moderate) positive (linear) correlation between the rank order of number of pages and the rank order top rating. A1
Note: Follow through from their value of .
[1 mark]
Examiners report
Emlyn plays many games of basketball for his school team. The number of minutes he plays in each game follows a normal distribution with mean minutes.
In any game there is a chance he will play less than .
In any game there is a chance he will play less than .
The standard deviation of the number of minutes Emlyn plays in any game is .
There is a chance Emlyn plays less than minutes in a game.
Emlyn will play in two basketball games today.
Emlyn and his teammate Johan each practise shooting the basketball multiple times from a point . A record of their performance over the weekend is shown in the table below.

On Monday, Emlyn and Johan will practise and each will shoot times from point .
Sketch a diagram to represent this information.
Show that .
Find the probability that Emlyn plays between and in a game.
Find the probability that Emlyn plays more than in a game.
Find the value of .
Find the probability he plays between and in one game and more than in the other game.
Find the expected number of successful shots Emlyn will make on Monday, based on the results from Saturday and Sunday.
Emlyn claims the results from Saturday and Sunday show that his expected number of successful shots will be more than Johan’s.
Determine if Emlyn’s claim is correct. Justify your reasoning.
Markscheme
* This question is from an exam for a previous syllabus, and may contain minor differences in marking or structure.
 (A1)(A1)
Note: Award (A1) for bell shaped curve with mean or indicated. Award (A1) for approximately correct shaded region.
[2 marks]
(M1)
OR
 (M1)
(M1)
Note: Award (M1) for correct probability equation using OR correctly shaded diagram indicating . Strict or weak inequalities are accepted in parts (b), (c) and (d).
OR (M1)
Note: Award (M0)(M1) for unsupported OR OR OR the midpoint of and is .
Award at most (M1)(M0) if the final answer is not seen. Award (M0)(M0) for using known values and to validate or .
(AG)
[2 marks]
(M1)
OR
 (M1)
(M1)
Note: Award (M1) for correct probability equation OR correctly shaded diagram indicating and .
(A1)(G2)
[2 marks]
(M1)
OR
 (M1)
(M1)
Note: Award (M1) for correct probability equation OR correctly shaded diagram indicating .
(A1)(G2)
[2 marks]
(M1)
OR
 (M1)
(M1)
Note: Award (M1) for correct probability equation OR for a correctly shaded region with indicated to the right-hand side of the mean.
(A1)(G2)
[2 marks]
(M1)(M1)
OR
(M1)(M1)
Note: Award (M1) for the multiplication of their parts (c)(i) and (c)(ii), (M1) for multiplying their product by or for adding their products twice. Follow through from part (c).
(A1)(ft)(G2)
Note: Award (G0) for an unsupported final answer of
[3 marks]
(M1)
Note: Award (M1) for correct probability multiplied by .
(A1)(G2)
[2 marks]
(A1)
Note: Award (M1) for or seen.
Emlyn is incorrect, (R1)
Note: To award the final (R1), both the conclusion and the comparison must be seen. Award at most (A0)(R1)(ft) for consistent incorrect methods in parts (f) and (g).
OR
(A1)
Note: Award (A1) for both correct probabilities seen.
Emlyn is incorrect, (R1)
Note: To award the final (R1), both the conclusion and the comparison must be seen. Award at most (A0)(R1)(ft) for consistent incorrect methods in parts (f) and (g).
[2 marks]
Examiners report
A random variable is normally distributed with mean, . In the following diagram, the shaded region between 9 and represents 30% of the distribution.

The standard deviation of is 2.1.
The random variable is normally distributed with mean and standard deviation 3.5. The events and are independent, and .
Find .
Find the value of .
Find .
Given that , find .
Markscheme
* This question is from an exam for a previous syllabus, and may contain minor differences in marking or structure.
valid approach (M1)
eg
(exact) A1 N2
[2 marks]
(may be seen in equation) (A1)
valid attempt to set up an equation with their (M1)
eg
10.7674
A1 N3
[3 marks]
(seen anywhere) (A1)
valid approach (M1)
eg
correct equation (A1)
eg
A1
A1 N3
[5 marks]
finding (seen anywhere) (A2)
recognizing conditional probability (M1)
eg
correct working (A1)
eg
0.746901
0.747 A1 N3
[5 marks]
Examiners report
The heights of adult males in a country are normally distributed with a mean of 180 cm and a standard deviation of . 17% of these men are shorter than 168 cm. 80% of them have heights between and 192 cm.
Find the value of .
Markscheme
* This question is from an exam for a previous syllabus, and may contain minor differences in marking or structure.
finding the -value for 0.17 (A1)
eg
setting up equation to find , (M1)
eg
(A1)
EITHER (Properties of the Normal curve)
correct value (seen anywhere) (A1)
eg
correct working (A1)
eg
correct equation in
eg (A1)
35.6536
A1 N3
OR (Trial and error using different values of h)
two correct probabilities whose 2 sf will round up and down, respectively, to 0.8 A2
eg
A2
[7 marks]
Examiners report
Arianne plays a game of darts.

The distance that her darts land from the centre, , of the board can be modelled by a normal distribution with mean and standard deviation .
Find the probability that
Each of Arianne’s throws is independent of her previous throws.
In a competition a player has three darts to throw on each turn. A point is scored if a player throws all three darts to land within a central area around . When Arianne throws a dart the probability that it lands within this area is .
In the competition Arianne has ten turns, each with three darts.
a dart lands less than from .
a dart lands more than from .
Find the probability that Arianne throws two consecutive darts that land more than from .
Find the probability that Arianne does not score a point on a turn of three darts.
Find the probability that Arianne scores at least points in the competition.
Find the probability that Arianne scores at least points and less than points.
Given that Arianne scores at least points, find the probability that Arianne scores less than points.
Markscheme
Let be the random variable “distance from ”.
(M1)(A1)
[2 marks]
A1
[1 mark]
(M1)
A1
[2 marks]
(M1)
A1
[2 marks]
METHOD 1
let be the random variable “number of points scored”
evidence of use of binomial distribution (M1)
(A1)
. A1
METHOD 2
let be the random variable “number of times a point is not scored”
evidence of use of binomial distribution (M1)
(A1)
A1
[3 marks]
(M1)
A1
Note: Award M1 for a correct probability statement or indication of correct lower and upper bounds, and .
[2 marks]
(M1)
A1
[2 marks]
Examiners report
Candidates appeared well prepared for straightforward questions using the normal distribution. Most were able to earn marks through recognition of the compound probability event in part (b). The wording of the information in part (c) required careful thought. This acted as a clear discriminator, causing difficulty for most candidates. One common error in this part was the calculation . Though at the end of the paper, it was pleasing to see many candidates identify the event in part (d) as binomial. A common error was the use of . It is recommended that candidates write down the distribution with associated parameters and support this with a probability statement. This will allow method and follow-through marks to be awarded in subsequent parts. Weaker candidates incorrectly used as the upper bound. Those who made it to the end of the paper were often rewarded for correct division of their probabilities found in parts (d)(i)&(ii).
Candidates appeared well prepared for straightforward questions using the normal distribution. Most were able to earn marks through recognition of the compound probability event in part (b). The wording of the information in part (c) required careful thought. This acted as a clear discriminator, causing difficulty for most candidates. One common error in this part was the calculation . Though at the end of the paper, it was pleasing to see many candidates identify the event in part (d) as binomial. A common error was the use of . It is recommended that candidates write down the distribution with associated parameters and support this with a probability statement. This will allow method and follow-through marks to be awarded in subsequent parts. Weaker candidates incorrectly used as the upper bound. Those who made it to the end of the paper were often rewarded for correct division of their probabilities found in parts (d)(i)&(ii).
Candidates appeared well prepared for straightforward questions using the normal distribution. Most were able to earn marks through recognition of the compound probability event in part (b). The wording of the information in part (c) required careful thought. This acted as a clear discriminator, causing difficulty for most candidates. One common error in this part was the calculation . Though at the end of the paper, it was pleasing to see many candidates identify the event in part (d) as binomial. A common error was the use of . It is recommended that candidates write down the distribution with associated parameters and support this with a probability statement. This will allow method and follow-through marks to be awarded in subsequent parts. Weaker candidates incorrectly used as the upper bound. Those who made it to the end of the paper were often rewarded for correct division of their probabilities found in parts (d)(i)&(ii).
Candidates appeared well prepared for straightforward questions using the normal distribution. Most were able to earn marks through recognition of the compound probability event in part (b). The wording of the information in part (c) required careful thought. This acted as a clear discriminator, causing difficulty for most candidates. One common error in this part was the calculation . Though at the end of the paper, it was pleasing to see many candidates identify the event in part (d) as binomial. A common error was the use of . It is recommended that candidates write down the distribution with associated parameters and support this with a probability statement. This will allow method and follow-through marks to be awarded in subsequent parts. Weaker candidates incorrectly used as the upper bound. Those who made it to the end of the paper were often rewarded for correct division of their probabilities found in parts (d)(i)&(ii).
Candidates appeared well prepared for straightforward questions using the normal distribution. Most were able to earn marks through recognition of the compound probability event in part (b). The wording of the information in part (c) required careful thought. This acted as a clear discriminator, causing difficulty for most candidates. One common error in this part was the calculation . Though at the end of the paper, it was pleasing to see many candidates identify the event in part (d) as binomial. A common error was the use of . It is recommended that candidates write down the distribution with associated parameters and support this with a probability statement. This will allow method and follow-through marks to be awarded in subsequent parts. Weaker candidates incorrectly used as the upper bound. Those who made it to the end of the paper were often rewarded for correct division of their probabilities found in parts (d)(i)&(ii).
Candidates appeared well prepared for straightforward questions using the normal distribution. Most were able to earn marks through recognition of the compound probability event in part (b). The wording of the information in part (c) required careful thought. This acted as a clear discriminator, causing difficulty for most candidates. One common error in this part was the calculation . Though at the end of the paper, it was pleasing to see many candidates identify the event in part (d) as binomial. A common error was the use of . It is recommended that candidates write down the distribution with associated parameters and support this with a probability statement. This will allow method and follow-through marks to be awarded in subsequent parts. Weaker candidates incorrectly used as the upper bound. Those who made it to the end of the paper were often rewarded for correct division of their probabilities found in parts (d)(i)&(ii).
Candidates appeared well prepared for straightforward questions using the normal distribution. Most were able to earn marks through recognition of the compound probability event in part (b). The wording of the information in part (c) required careful thought. This acted as a clear discriminator, causing difficulty for most candidates. One common error in this part was the calculation . Though at the end of the paper, it was pleasing to see many candidates identify the event in part (d) as binomial. A common error was the use of . It is recommended that candidates write down the distribution with associated parameters and support this with a probability statement. This will allow method and follow-through marks to be awarded in subsequent parts. Weaker candidates incorrectly used as the upper bound. Those who made it to the end of the paper were often rewarded for correct division of their probabilities found in parts (d)(i)&(ii).
A group of 7 adult men wanted to see if there was a relationship between their Body Mass Index (BMI) and their waist size. Their waist sizes, in centimetres, were recorded and their BMI calculated. The following table shows the results.

The relationship between and can be modelled by the regression equation .
Write down the value of and of .
Find the correlation coefficient.
Use the regression equation to estimate the BMI of an adult man whose waist size is 95 cm.
Markscheme
valid approach (M1)
eg correct value for or (or for correct or = 0.955631 seen in (ii))
0.141120, 11.1424
= 0.141, = 11.1 A1A1 N3
[3 marks]
0.977563
= 0.978 A1 N1
[1 mark]
correct substitution into their regression equation (A1)
eg 0.141(95) + 11.1
24.5488
24.5 A1 N2
[2 marks]
Examiners report
Let . The line is tangent to the graph of at .
can be expressed in the form r u.
The direction vector of is .
Find the gradient of .
Find u.
Find the acute angle between and .
Find .
Hence, write down .
Hence or otherwise, find the obtuse angle formed by the tangent line to at and the tangent line to at .
Markscheme
* This question is from an exam for a previous syllabus, and may contain minor differences in marking or structure.
attempt to find (M1)
eg , ,
−0.25 (exact) A1 N2
[2 marks]
u or any scalar multiple A2 N2
[2 marks]
correct scalar product and magnitudes (A1)(A1)(A1)
scalar product
magnitudes ,
substitution of their values into correct formula (M1)
eg , , 2.1112, 120.96°
1.03037 , 59.0362°
angle = 1.03 , 59.0° A1 N4
[5 marks]
attempt to form composite (M1)
eg , ,
correct working (A1)
eg ,
A1 N2
[3 marks]
(accept , ) A1 N1
Note: Award A0 in part (ii) if part (i) is incorrect.
Award A0 in part (ii) if the candidate has found by interchanging and .
[1 mark]
METHOD 1
recognition of symmetry about (M1)
eg (2, 8) ⇔ (8, 2) 
evidence of doubling their angle (M1)
eg ,
2.06075, 118.072°
2.06 (radians) (118 degrees) A1 N2
METHOD 2
finding direction vector for tangent line at (A1)
eg ,
substitution of their values into correct formula (must be from vectors) (M1)
eg ,
2.06075, 118.072°
2.06 (radians) (118 degrees) A1 N2
METHOD 3
using trigonometry to find an angle with the horizontal (M1)
eg ,
finding both angles of rotation (A1)
eg ,
2.06075, 118.072°
2.06 (radians) (118 degrees) A1 N2
[3 marks]
Examiners report
The weights, in grams, of oranges grown in an orchard, are normally distributed with a mean of 297 g. It is known that 79 % of the oranges weigh more than 289 g and 9.5 % of the oranges weigh more than 310 g.
The weights of the oranges have a standard deviation of σ.
The grocer at a local grocery store will buy the oranges whose weights exceed the 35th percentile.
The orchard packs oranges in boxes of 36.
Find the probability that an orange weighs between 289 g and 310 g.
Find the standardized value for 289 g.
Hence, find the value of σ.
To the nearest gram, find the minimum weight of an orange that the grocer will buy.
Find the probability that the grocer buys more than half the oranges in a box selected at random.
The grocer selects two boxes at random.
Find the probability that the grocer buys more than half the oranges in each box.
Markscheme
* This question is from an exam for a previous syllabus, and may contain minor differences in marking or structure.
correct approach indicating subtraction (A1)
eg 0.79 − 0.095, appropriate shading in diagram
P(289 < w < 310) = 0.695 (exact), 69.5 % A1 N2
[2 marks]
METHOD 1
valid approach (M1)
eg 1 − p, 21
−0.806421
z = −0.806 A1 N2
METHOD 2
(i) & (ii)
correct expression for z (seen anywhere) (A1)
eg
valid approach (M1)
eg 1 − p, 21
−0.806421
z = −0.806 (seen anywhere) A1 N2
[2 marks]
METHOD 1
attempt to standardize (M1)
eg
correct substitution with their z (do not accept a probability) A1
eg
9.92037
σ = 9.92 A1 N2
METHOD 2
(i) & (ii)
correct expression for z (seen anywhere) (A1)
eg
valid approach (M1)
eg 1 − p, 21
−0.806421
z = −0.806 (seen anywhere) A1 N2
valid attempt to set up an equation with their z (do not accept a probability) (M1)
eg
9.92037
σ = 9.92 A1 N2
[3 marks]
valid approach (M1)
eg P(W < w) = 0.35, −0.338520 (accept 0.385320), diagram showing values in a standard normal distribution
correct score at the 35th percentile (A1)
eg 293.177
294 (g) A1 N2
Note: If working shown, award (M1)(A1)A0 for 293.
If no working shown, award N1 for 293.177, N1 for 293.
Exception to the FT rule: If the score is incorrect, and working shown, award A1FT for correctly finding their minimum weight (by rounding up)
[3 marks]
evidence of recognizing binomial (seen anywhere) (M1)
eg
correct probability (seen anywhere) (A1)
eg 0.65
EITHER
finding P(X ≤ 18) from GDC (A1)
eg 0.045720
evidence of using complement (M1)
eg 1−P(X ≤ 18)
0.954279
P(X > 18) = 0.954 A1 N2
OR
recognizing P(X > 18) = P(X ≥ 19) (M1)
summing terms from 19 to 36 (A1)
eg P(X = 19) + P(X = 20) + … + P(X = 36)
0.954279
P(X > 18) = 0.954 A1 N2
[5 marks]
correct calculation (A1)
0.910650
0.911 A1 N2
[2 marks]
Examiners report
The following table shows a probability distribution for the random variable , where .
A bag contains white and blue marbles, with at least three of each colour. Three marbles are drawn from the bag, without replacement. The number of blue marbles drawn is given by the random variable .
A game is played in which three marbles are drawn from the bag of ten marbles, without replacement. A player wins a prize if three white marbles are drawn.
Jill plays the game nine times. Find the probability that she wins exactly two prizes.
Markscheme
valid approach (M1)
eg
0.279081
0.279 A1 N2
[2 marks]
Examiners report
Ten students were surveyed about the number of hours, , they spent browsing the Internet during week 1 of the school year. The results of the survey are given below.
During week 4, the survey was extended to all 200 students in the school. The results are shown in the cumulative frequency graph:

Find the mean number of hours spent browsing the Internet.
During week 2, the students worked on a major project and they each spent an additional five hours browsing the Internet. For week 2, write down
(i) the mean;
(ii) the standard deviation.
During week 3 each student spent 5% less time browsing the Internet than during week 1. For week 3, find
(i) the median;
(ii) the variance.
(i) Find the number of students who spent between 25 and 30 hours browsing the Internet.
(ii) Given that 10% of the students spent more than k hours browsing the Internet, find the maximum value of .
Markscheme
* This question is from an exam for a previous syllabus, and may contain minor differences in marking or structure.
attempt to substitute into formula for mean (M1)
eg
mean A1 N2
[2 marks]
(i) mean A1 N1
(ii) A1 N1
[2 marks]
(i) valid approach (M1)
eg95%, 5% of 27
correct working (A1)
eg
median A1 N2
(ii) METHOD 1
variance (seen anywhere) (A1)
valid attempt to find new standard deviation (M1)
eg
variance A1 N2
METHOD 2
variance (seen anywhere) (A1)
valid attempt to find new variance (M1)
eg
new variance A1 N2
[6 marks]
(i) both correct frequencies (A1)
eg80, 150
subtracting their frequencies in either order (M1)
eg
70 (students) A1 N2
(ii) evidence of a valid approach (M1)
eg10% of 200, 90%
correct working (A1)
eg, 180 students
A1 N3
[6 marks]
Examiners report
The following table shows the mean weight, y kg , of children who are x years old.

The relationship between the variables is modelled by the regression line with equation .
Find the value of a and of b.
Write down the correlation coefficient.
Use your equation to estimate the mean weight of a child that is 1.95 years old.
Markscheme
valid approach (M1)
eg correct value for a or b (or for r seen in (ii))
a = 1.91966 b = 7.97717
a = 1.92, b = 7.98 A1A1 N3
[3 marks]
0.984674
r = 0.985 A1 N1
[1 mark]
correct substitution into their equation (A1)
eg 1.92 × 1.95 + 7.98
11.7205
11.7 (kg) A1 N2
[2 marks]
Examiners report
A healthy human body temperature is 37.0 °C. Eight people were medically examined and the difference in their body temperature (°C), from 37.0 °C, was recorded. Their heartbeat (beats per minute) was also recorded.

Write down, for this set of data the mean temperature difference from 37 °C, .
Write down, for this set of data the mean number of heartbeats per minute, .
Plot and label the point M(, ) on the scatter diagram.
Use your graphic display calculator to find the Pearson’s product–moment correlation coefficient, .
Hence describe the correlation between temperature difference from 37 °C and heartbeat.
Draw the regression line on on the scatter diagram.
Markscheme
0.025 (A1)
[1 mark]
74 (A1)
[1 mark]
the point M labelled, correctly plotted on their diagram (A1)(A1)(ft)
Note: Award (A1) for labelled M. Do not accept any other label. Award (A1)(ft) for their point M correctly plotted. Follow through from part (b).
[2 marks]
0.807 (0.806797…) (G2)
[2 marks]
(moderately) strong, positive (A1)(ft)(A1)(ft)
Note: Award (A1) for (moderately) strong, (A1) for positive. Follow through from part (d)(i). If there is no answer to part (d)(i), award at most (A0)(A1).
[2 marks]
their regression line correctly drawn on scatter diagram (A1)(ft)(A1)(ft)
Note: Award (A1)(ft) for a straight line, using a ruler, intercepting their mean point, and (A1)(ft) for intercepting the -axis at their 73.5 and the gradient of the line is positive. If graph paper is not used, award at most (A1)(A0). Follow through from part (e).
[2 marks]
Examiners report
A teacher is concerned about the amount of lesson time lost by students through arriving late at school. Over a period of weeks he records the total number of minutes they are late. He also asks them how far they live from school. The results are shown in the table below.

Which of the correlation coefficients would you recommend is used to assess whether or not there is an association between total number of minutes late and distance from school? Fully justify your answer.
Markscheme
Spearman’s rank correlation should be used A1
Because the product moment correlation coefficient is distorted by an outlier. R1
Note: Do not award A1R0
[2 marks]
Examiners report
Adam is a beekeeper who collected data about monthly honey production in his bee hives. The data for six of his hives is shown in the following table.

The relationship between the variables is modelled by the regression line with equation .
Adam has 200 hives in total. He collects data on the monthly honey production of all the hives. This data is shown in the following cumulative frequency graph.

Adam’s hives are labelled as low, regular or high production, as defined in the following table.

Adam knows that 128 of his hives have a regular production.
Write down the value of and of .
Use this regression line to estimate the monthly honey production from a hive that has 270 bees.
Write down the number of low production hives.
Find the value of ;
Find the number of hives that have a high production.
Adam decides to increase the number of bees in each low production hive. Research suggests that there is a probability of 0.75 that a low production hive becomes a regular production hive. Calculate the probability that 30 low production hives become regular production hives.
Markscheme
* This question is from an exam for a previous syllabus, and may contain minor differences in marking or structure.
evidence of setup (M1)
egcorrect value for or
A1A1 N3
[3 marks]
substituting into their equation (M1)
eg
1424.67
A1 N2
[2 marks]
40 (hives) A1 N1
[1 mark]
valid approach (M1)
eg
168 hives have a production less than (A1)
A1 N3
[3 marks]
valid approach (M1)
eg
32 (hives) A1 N2
[2 marks]
recognize binomial distribution (seen anywhere) (M1)
eg
correct values (A1)
eg (check FT) and and
0.144364
0.144 A1 N2
[3 marks]
Examiners report
The manager of a folder factory recorded the number of folders produced by the factory (in thousands) and the production costs (in thousand Euros), for six consecutive months.

Every month the factory sells all the folders produced. Each folder is sold for 2.99 Euros.
Draw a scatter diagram for this data. Use a scale of 2 cm for 5000 folders on the horizontal axis and 2 cm for 10 000 Euros on the vertical axis.
Write down, for this set of data the mean number of folders produced, ;
Write down, for this set of data the mean production cost, .
Label the point on the scatter diagram.
State a reason why the regression line on is appropriate to model the relationship between these variables.
Use your graphic display calculator to find the equation of the regression line on .
Draw the regression line on on the scatter diagram.
Use the equation of the regression line to estimate the least number of folders that the factory needs to sell in a month to exceed its production cost for that month.
Markscheme
* This question is from an exam for a previous syllabus, and may contain minor differences in marking or structure.
 (A4)
(A4)
Notes: Award (A1) for correct scales and labels. Award (A0) if axes are reversed and follow through for their points.
Award (A3) for all six points correctly plotted, (A2) for four or five points correctly plotted, (A1) for two or three points correctly plotted.
If graph paper has not been used, award at most (A1)(A0)(A0)(A0). If accuracy cannot be determined award (A0)(A0)(A0)(A0).
[4 marks]
(A1)(G1)
[1 mark]
(A1)(G1)
Note: Accept (i) 21000 and (ii) 55000 seen.
[1 mark]
their mean point M labelled on diagram (A1)(ft)(G1)
Note: Follow through from part (b).
Award (A1)(ft) if their part (b) is correct and their attempt at plotting in part (a) is labelled M.
If graph paper not used, award (A1) if is labelled. If their answer from part (b) is incorrect and accuracy cannot be determined, award (A0).
[1 mark]
the correlation coefficient/r is (very) close to 1 (R1)(ft)
OR
the correlation is (very) strong (R1)(ft)
Note: Follow through from their answer to part (d).
OR
the position of the data points on the scatter graphs suggests that the tendency is linear (R1)(ft)
Note: Follow through from their scatter graph in part (a).
[1 mark]
(G2)
Notes: Award (G1) for , (G1) for 14.2.
Award a maximum of (G0)(G1) if the answer is not an equation.
Award (G0)(G1)(ft) if gradient and -intercept are swapped in the equation.
[2 marks]
straight line through their (A1)(ft)
-intercept of the line (or extension of line) passing through (A1)(ft)
Notes: Follow through from part (f). In the event that the regression line is not straight (ruler not used), award (A0)(A1)(ft) if line passes through both their and , otherwise award (A0)(A0). The line must pass through the midpoint, not near this point. If it is not clear award (A0).
If graph paper is not used, award at most (A1)(ft)(A0).
[2 marks]
(M1)(M1)
Note: Award (M1) for seen and (M1) for equating to their equation of the regression line. Accept an inequality sign.
Accept a correct graphical method involving their part (f) and .
Accept drawn on their scatter graph.
(this step may be implied by their final answer) (A1)(ft)(G2)
(A1)(ft)(G3)
Note: Follow through from their answer to (f). Use of 3 sf gives an answer of .
Award (G2) for or 13.524 or a value which rounds to 13500 seen without workings.
Award the last (A1)(ft) for correct multiplication by 1000 and an answer satisfying revenue > their production cost.
Accept 13.6 thousand (folders).
[4 marks]
Examiners report
In a large university the probability that a student is left handed is 0.08. A sample of 150 students is randomly selected from the university. Let be the expected number of left-handed students in this sample.
Find .
Hence, find the probability that exactly students are left handed;
Hence, find the probability that fewer than students are left handed.
Markscheme
* This question is from an exam for a previous syllabus, and may contain minor differences in marking or structure.
evidence of binomial distribution (may be seen in part (b)) (M1)
eg
A1 N2
[2 marks]
(A1)
0.119231
probability A1 N2
[2 marks]
recognition that (M1)
0.456800
A1 N2
[2 marks]
Examiners report
Contestants in a TV gameshow try to get through three walls by passing through doors without falling into a trap. Contestants choose doors at random.
If they avoid a trap they progress to the next wall.
If a contestant falls into a trap they exit the game before the next contestant plays.
Contestants are not allowed to watch each other attempt the game.

The first wall has four doors with a trap behind one door.
Ayako is a contestant.
Natsuko is the second contestant.
The second wall has five doors with a trap behind two of the doors.
The third wall has six doors with a trap behind three of the doors.
The following diagram shows the branches of a probability tree diagram for a contestant in the game.

Write down the probability that Ayako avoids the trap in this wall.
Find the probability that only one of Ayako and Natsuko falls into a trap while attempting to pass through a door in the first wall.
Copy the probability tree diagram and write down the relevant probabilities along the branches.
A contestant is chosen at random. Find the probability that this contestant fell into a trap while attempting to pass through a door in the second wall.
A contestant is chosen at random. Find the probability that this contestant fell into a trap.
120 contestants attempted this game.
Find the expected number of contestants who fell into a trap while attempting to pass through a door in the third wall.
Markscheme
* This question is from an exam for a previous syllabus, and may contain minor differences in marking or structure.
(0.75, 75%) (A1)
[1 mark]
OR (M1)(M1)
Note: Award (M1) for their product seen, and (M1) for adding their two products or multiplying their product by 2.
(A1)(ft) (G3)
Note: Follow through from part (a), but only if the sum of their two fractions is 1.
[3 marks]
 (A1)(ft)(A1)(A1)
Note: Award (A1) for each correct pair of branches. Follow through from part (a).
[3 marks]
(M1)
Note: Award (M1) for correct probabilities multiplied together.
(A1)(ft) (G2)
Note: Follow through from their tree diagram or part (a).
[2 marks]
OR (M1)(M1)
Note: Award (M1) for and (M1) for subtracting their correct probability from 1, or adding to their .
(A1)(ft) (G2)
Note: Follow through from their tree diagram.
[3 marks]
(M1)(M1)
Note: Award (M1) for and (M1) for multiplying by 120.
= 27 (A1)(ft) (G3)
Note: Follow through from their tree diagram or their from their calculation in part (d)(ii).
[3 marks]
Examiners report
A manufacturer produces 1500 boxes of breakfast cereal every day.
The weights of these boxes are normally distributed with a mean of 502 grams and a standard deviation of 2 grams.
All boxes of cereal with a weight between 497.5 grams and 505 grams are sold. The manufacturer’s income from the sale of each box of cereal is $2.00.
The manufacturer recycles any box of cereal with a weight not between 497.5 grams and 505 grams. The manufacturer’s recycling cost is $0.16 per box.
A different manufacturer produces boxes of cereal with weights that are normally distributed with a mean of 350 grams and a standard deviation of 1.8 grams.
This manufacturer sells all boxes of cereal that are above a minimum weight, .
They sell 97% of the cereal boxes produced.
Draw a diagram that shows this information.
(i) Find the probability that a box of cereal, chosen at random, is sold.
(ii) Calculate the manufacturer’s expected daily income from these sales.
Calculate the manufacturer’s expected daily recycling cost.
Calculate the value of .
Markscheme
* This question is from an exam for a previous syllabus, and may contain minor differences in marking or structure.

(A1)(A1)
Notes: Award (A1) for bell shape with mean of 502.
Award (A1) for an indication of standard deviation eg 500 and 504.
[2 marks]
(i) (G2)
Note: Award (M1) for a diagram showing the correct shaded region.
(ii) (M1)
(A1)(ft)(G2)
Note: Follow through from their answer to part (b)(i).
[4 marks]
(M1)
Notes: Award (A1) for .
OR
(M1)
Notes: Award (M1) for .
(A1)(ft)(G2)
[2 marks]
(G3)
Notes: Award (G2) for an answer that rounds to 346.
Award (G1) for seen without working (for finding the top 3%).
[3 marks]
Examiners report
Jim writes a computer program to generate 500 values of a variable Z. He obtains the following table from his results.

In this situation, state briefly what is meant by
Use a chi-squared goodness of fit test to investigate whether or not, at the 5 % level of significance, the N(0, 1) distribution can be used to model these results.
a Type I error.
a Type II error.
Markscheme
 (A1)(A1)(A1)(A1)(A1)(A1)
(M1)
= 7.94 A1
Degrees of freedom = 5 A1
Critical value = 11.07 A1
Or use of p-value
We conclude that the data fit the N(0, 1) distribution. R1
at the 5% level of significance A1
[12 marks]
Type I error concluding that the data do not fit N(0, 1) when in fact they do. R2
[2 marks]
Type II error concluding that data fit N(0, 1) when in fact they do not. R2
[2 marks]
Examiners report
Casanova restaurant offers a set menu where a customer chooses one of the following meals: pasta, fish or shrimp.
The manager surveyed customers and recorded the customer’s age and chosen meal. The data is shown in the following table.

A test was performed at the significance level. The critical value for this test is .
Write down
A customer is selected at random.
State , the null hypothesis for this test.
Write down the number of degrees of freedom.
Show that the expected number of children who chose shrimp is , correct to two significant figures.
the statistic.
the -value.
State the conclusion for this test. Give a reason for your answer.
Calculate the probability that the customer is an adult.
Calculate the probability that the customer is an adult or that the customer chose shrimp.
Given that the customer is a child, calculate the probability that they chose pasta or fish.
Markscheme
choice of meal is independent of age (or equivalent) (A1)
Note: Accept "not associated" or "not dependent" instead of independent. In lieu of "age", accept an equivalent alternative such as "being a child or adult".
[1 mark]
2 (A1)
[1 mark]
OR (M1)
Note: Award (M1) for correct substitution into expected frequency formula.
(A1)
(AG)
Note: Both an unrounded answer that rounds to the given answer and rounded answer must be seen for the (A1) to be awarded.
[2 marks]
(G2)
[2 marks]
(-value ) (G1)
Note: Award (G0)(G2) if the statistic is missing or incorrect and the -value is correct.
[1 mark]
OR (R1)(ft)
the null hypothesis is not rejected (A1)(ft)
OR
the choice of meal is independent of age (or equivalent) (A1)(ft)
Note: Award (R1)(ft)) for a correct comparison of either their statistic to the critical value or their -value to the significance level.
Condone “accept” in place of “not reject”.
Follow through from parts (a) and (d).
Do not award (A1)(ft)(R0).
[2 marks]
(A1)(A1)(G2)
Note: Award (A1) for numerator, (A1) for denominator.
[2 marks]
(A1)(A1)(G2)
Note: Award (A1) for numerator, (A1) for denominator.
[2 marks]
(A1)(A1)(G2)
Note: Award (A1) for numerator, (A1) for denominator.
[2 marks]
Examiners report
A nationwide study on reaction time is conducted on participants in two age groups. The participants in Group X are less than 40 years old. Their reaction times are normally distributed with mean 0.489 seconds and standard deviation 0.07 seconds.
The participants in Group Y are 40 years or older. Their reaction times are normally distributed with mean 0.592 seconds and standard deviation σ seconds.
In the study, 38 % of the participants are in Group X.
A randomly selected participant has a reaction time greater than 0.65 seconds. Find the probability that the participant is in Group X.
Ten of the participants with reaction times greater than 0.65 are selected at random. Find the probability that at least two of them are in Group X.
Markscheme
correct work for P(group X and > 0.65) or P(group Y and > 0.65) (may be seen anywhere) (A1)
eg , ,
recognizing conditional probability (seen anywhere) (M1)
eg ,
valid approach to find (M1)
eg  ,
,
correct work for (A1)
eg 0.0107 × 0.38 + 0.396 × 0.62, 0.249595
correct substitution into conditional probability formula A1
eg ,
0.016327
A1 N3
[6 marks]
recognizing binomial probability (M1)
eg , , (0.016327)2(0.983672)8,
valid approach (M1)
eg , , summing terms from 2 to 10 (accept binomcdf(10, 0.0163, 2, 10))
0.010994
A1 N2
[3 marks]
Examiners report
At Penna Airport the probability, P(A), that all passengers arrive on time for a flight is 0.70. The probability, P(D), that a flight departs on time is 0.85. The probability that all passengers arrive on time for a flight and it departs on time is 0.65.
The number of hours that pilots fly per week is normally distributed with a mean of 25 hours and a standard deviation . 90 % of pilots fly less than 28 hours in a week.
Show that event A and event D are not independent.
Find .
Given that all passengers for a flight arrive on time, find the probability that the flight does not depart on time.
Find the value of .
All flights have two pilots. Find the percentage of flights where both pilots flew more than 30 hours last week.
Markscheme
* This question is from an exam for a previous syllabus, and may contain minor differences in marking or structure.
METHOD 1
multiplication of P(A) and P(D) (A1)
eg 0.70 × 0.85, 0.595
correct reasoning for their probabilities R1
eg ,
A and D are not independent AG N0
METHOD 2
calculation of (A1)
eg , 0.928
correct reasoning for their probabilities R1
eg ,
A and D are not independent AG N0
[2 marks]
correct working (A1)
eg , 0.7 − 0.65 , correct shading and/or value on Venn diagram
A1 N2
[2 marks]
recognizing conditional probability (seen anywhere) (M1)
eg ,
correct working (A1)
eg
0.071428
, 0.0714 A1 N2
[3 marks]
finding standardized value for 28 hours (seen anywhere) (A1)
eg
correct working to find (A1)
eg ,
2.34091
A1 N2
[3 marks]
(A1)
valid approach (seen anywhere) (M1)
eg , (0.01634)2 , B(2, 0.0163429) , 2.67E-4 , 2.66E-4
0.0267090
0.0267 % A2 N3
[4 marks]
Examiners report
The following table shows the average body weight, , and the average weight of the brain, , of seven species of mammal. Both measured in kilograms (kg).

The average body weight of grey wolves is 36 kg.
In fact, the average weight of the brain of grey wolves is 0.120 kg.
Find the range of the average body weights for these seven species of mammal.
For the data from these seven species calculate , the Pearson’s product–moment correlation coefficient;
For the data from these seven species describe the correlation between the average body weight and the average weight of the brain.
Write down the equation of the regression line on , in the form .
Use your regression line to estimate the average weight of the brain of grey wolves.
Find the percentage error in your estimate in part (d).
Markscheme
* This question is from an exam for a previous syllabus, and may contain minor differences in marking or structure.
(M1)
(A1)(G2)
[2 marks]
(G2)
[2 marks]
(very) strong, positive (A1)(ft)(A1)(ft)
Note: Follow through from part (b)(i).
[2 marks]
(A1)(A1)
Note: Award (A1) for , (A1) for 0.0923.
Award a maximum of (A1)(A0) if the answer is not an equation in the form .
[2 marks]
(M1)
Note: Award (M1) for substituting 36 into their equation.
(A1)(ft)(G2)
Note: Follow through from part (c). The final (A1) is awarded only if their answer is positive.
[2 marks]
(M1)
Note: Award (M1) for their correct substitution into percentage error formula.
(A1)(ft)(G2)
Note: Follow through from part (d). Do not accept a negative answer.
[2 marks]
Examiners report
A biased four-sided die is rolled. The following table gives the probability of each score.

Find the value of k.
Calculate the expected value of the score.
The die is rolled 80 times. On how many rolls would you expect to obtain a three?
Markscheme
* This question is from an exam for a previous syllabus, and may contain minor differences in marking or structure.
evidence of summing to 1 (M1)
eg 0.28 + k + 1.5 + 0.3 = 1, 0.73 + k = 1
k = 0.27 A1 N2
[2 marks]
correct substitution into formula for E (X) (A1)
eg 1 × 0.28 + 2 × k + 3 × 0.15 + 4 × 0.3
E (X) = 2.47 (exact) A1 N2
[2 marks]
valid approach (M1)
eg np, 80 × 0.15
12 A1 N2
[2 marks]
Examiners report
The Malvern Aquatic Center hosted a 3 metre spring board diving event. The judges, Stan and Minsun awarded 8 competitors a score out of 10. The raw data is collated in the following table.

The Commissioner for the event would like to find the Spearman’s rank correlation coefficient.
Write down the value of the Pearson’s product–moment correlation coefficient, .
Using the value of , interpret the relationship between Stan’s score and Minsun’s score.
Write down the equation of the regression line on .
Use your regression equation from part (b) to estimate Minsun’s score when Stan awards a perfect 10.
State whether this estimate is reliable. Justify your answer.
Copy and complete the information in the following table.

Find the value of the Spearman’s rank correlation coefficient, .
Comment on the result obtained for .
The Commissioner believes Minsun’s score for competitor G is too high and so decreases the score from 9.5 to 9.1.
Explain why the value of the Spearman’s rank correlation coefficient does not change.
Markscheme
0.909 (0.909181…) A2
[2 marks]
(very) strong and positive A1A1
Note: Award A1 for (very) strong A1 for positive.
[2 marks]
A1A1
Note: Award A1 for , A1 for . Award a maximum of A1A0 if the answer is not an equation in the form .
[2 marks]
1.14 × 10 + 0.578 M1
12.0 (11.9814…) A1
[2 marks]
no the estimate is not reliable A1
outside the known data range R1
OR
a score greater than 10 is not possible R1
Note: Do not award A1R0.
[2 marks]
 A1A1
A1A1
Note: Award A1 for correct ranks for Stan. Award A1 for correct ranks for Minsun.
[2 marks]
0.933 (0.932673…) A2
[2 marks]
Stan and Minsun strongly agree on the ranking of competitors. A1A1
Note: Award A1 for “strongly agree”, A1 for reference to a rank order.
[2 marks]
decreasing the score to 9.1, does not change the rank of competitor G A1
[1 mark]
Examiners report
Lucy sells hot chocolate drinks at her snack bar and has noticed that she sells more hot chocolates on cooler days. On six different days, she records the maximum daily temperature, , measured in degrees centigrade, and the number of hot chocolates sold, . The results are shown in the following table.

The relationship between and can be modelled by the regression line with equation .
Find the value of and of .
Write down the correlation coefficient.
Using the regression equation, estimate the number of hot chocolates that Lucy will sell on a day when the maximum temperature is .
Markscheme
valid approach (M1)
eg correct value for or (or for or seen in (ii))
A1A1 N3
[3 marks]
A1 N1
[1 mark]
correct substitution into their equation (A1)
eg
( from )
(hot chocolates) A1 N2
[2 marks]
Examiners report
The aircraft for a particular flight has seats. The airline’s records show that historically for this flight only of the people who purchase a ticket arrive to board the flight. They assume this trend will continue and decide to sell extra tickets and hope that no more than passengers will arrive.
The number of passengers that arrive to board this flight is assumed to follow a binomial distribution with a probability of .
Each passenger pays for a ticket. If too many passengers arrive, then the airline will give in compensation to each passenger that cannot board.
The airline sells tickets for this flight. Find the probability that more than passengers arrive to board the flight.
Write down the expected number of passengers who will arrive to board the flight if tickets are sold.
Find the maximum number of tickets that could be sold if the expected number of passengers who arrive to board the flight must be less than or equal to .
Find, to the nearest integer, the expected increase or decrease in the money made by the airline if they decide to sell tickets rather than .
Markscheme
(let be the number of passengers who arrive)
OR (A1)
OR (M1)
A1
Note: Using the distribution , to work with the that do not arrive for the flight, here and throughout this question, is a valid approach.
[3 marks]
(M1)
A1
[2 marks]
(M1)
80 A1
[2 marks]
METHOD 1
EITHER
when selling tickets

top row A1A1
bottom row A1A1
Note: Award A1A1 for each row correct. Award A1 for one correct entry and A1 for the remaining entries correct.
(M1)A1
OR
income is (A1)
expected compensation is
(M1)A1A1
expected income when selling tickets is (M1)
A1
THEN
income for tickets (A1)
so expected gain A1
METHOD 2
for tickets sold, let be the compensation paid out
A1A1
(M1)A1A1
extra expected revenue (A1)(M1)
Note: Award A1 for the and M1 for the subtraction.
(to the nearest dollar) A1
METHOD 3
let be the change in income when selling tickets.
 (A1)(A1)
Note: Award A1 for one error, however award A1A1 if there is no explicit mention that would result in and the other two are correct.
A1A1
(M1)A1A1
A1
[8 marks]
Examiners report
In part (a) Stronger candidates were able to recognize that they needed to use the binomial to find the probability. Some candidates confused binomialpdf and binomialcdf functions. Some did not understand that “more than 72” means “73 or 74” and how their GDC uses the lower boundary parameter.
In part (b) many candidates could find the expected number of passengers and the maximum number of tickets. This part was well attempted.
Part (c) was expected to challenge the strongest candidates and had little scaffolding. However, this may have been too much for this cohort and resulted in few marks being awarded. A variety of methods were used but few progressed beyond finding values of income minus compensation. Only a few candidates took probabilities into consideration.
The mass M of apples in grams is normally distributed with mean μ. The following table shows probabilities for values of M.

The apples are packed in bags of ten.
Any apples with a mass less than 95 g are classified as small.
Write down the value of k.
Show that μ = 106.
Find P(M < 95) .
Find the probability that a bag of apples selected at random contains at most one small apple.
Find the expected number of bags in this crate that contain at most one small apple.
Find the probability that at least 48 bags in this crate contain at most one small apple.
Markscheme
evidence of using (M1)
eg k + 0.98 + 0.01 = 1
k = 0.01 A1 N2
[2 marks]
recognizing that 93 and 119 are symmetrical about μ (M1)
eg μ is midpoint of 93 and 119
correct working to find μ A1
μ = 106 AG N0
[2 marks]
finding standardized value for 93 or 119 (A1)
eg z = −2.32634, z = 2.32634
correct substitution using their z value (A1)
eg
σ = 5.58815 (A1)
0.024508
P(X < 95) = 0.0245 A2 N3
[5 marks]
evidence of recognizing binomial (M1)
eg 10, ananaCpqn−=××and 0.024B(5,,)pnp=
valid approach (M1)
eg P(1),P(0)P(1)XXX≤=+=
0.976285
0.976 A1 N2
[3 marks]
recognizing new binomial probability (M1)
eg B(50, 0.976)
correct substitution (A1)
eg E(X) = 50 (0.976285)
48.81425
48.8 A1 N2
[3 marks]
valid approach (M1)
eg P(X ≥ 48), 1 − P(X ≤ 47)
0.884688
0.885 A1 N2
[2 marks]
Examiners report
Consider the function , .
Find .
The graph of has a horizontal tangent line at and at . Find .
Markscheme
* This question is from an exam for a previous syllabus, and may contain minor differences in marking or structure.
choosing product rule (M1)
eg ,
correct derivatives (must be seen in the rule) A1A1
eg ,
A1 N4
[4 marks]
valid method (M1)
eg ,  ,
, 
(accept ) A1 N2
[2 marks]
Examiners report
The weights, , of newborn babies in Australia are normally distributed with a mean 3.41 kg and standard deviation 0.57 kg. A newborn baby has a low birth weight if it weighs less than kg.
Given that 5.3% of newborn babies have a low birth weight, find .
A newborn baby has a low birth weight.
Find the probability that the baby weighs at least 2.15 kg.
Markscheme
* This question is from an exam for a previous syllabus, and may contain minor differences in marking or structure.
valid approach (M1)
eg, 
2.48863
A2 N3
[3 marks]
correct value or expression (seen anywhere)
eg (A1)
evidence of conditional probability (M1)
eg
0.744631
0.745 A1 N2
[3 marks]
Examiners report
A discrete random variable has the following probability distribution.

Find an expression for in terms of .
Find the value of which gives the largest value of .
Hence, find the largest value of .
Markscheme
* This question is from an exam for a previous syllabus, and may contain minor differences in marking or structure.
evidence of summing probabilities to (M1)
eg
A1 N2
[2 marks]
correct substitution into formula (A1)
eg
valid approach to find when is a maximum (M1)
eg max on sketch of , ,
(exact) (accept ) A1 N3
[3 marks]
(exact), A1 N1
[1 mark]
Examiners report
The following diagram shows the graph of , for .

The graph of has a minimum point at and a maximum point at .
The graph of is obtained from the graph of by a translation of . The maximum point on the graph of has coordinates .
The graph of changes from concave-up to concave-down when .
(i) Find the value of .
(ii) Show that .
(iii) Find the value of .
(i) Write down the value of .
(ii) Find .
(i) Find .
(ii) Hence or otherwise, find the maximum positive rate of change of .
Markscheme
* This question is from an exam for a previous syllabus, and may contain minor differences in marking or structure.
(i) valid approach (M1)
eg
A1 N2
(ii) valid approach (M1)
egperiod is 12, per
A1
AG N0
(iii) METHOD 1
valid approach (M1)
eg, substitution of points
A1 N2
METHOD 2
valid approach (M1)
eg, amplitude is 6
A1 N2
[6 marks]
(i) A1 N1
(ii) A2 N2
[3 marks]
(i) METHOD 1 Using
recognizing that a point of inflexion is required M1
egsketch, recognizing change in concavity
evidence of valid approach (M1)
eg, sketch, coordinates of max/min on
(exact) A1 N2
METHOD 2 Using
recognizing that a point of inflexion is required M1
egsketch, recognizing change in concavity
evidence of valid approach involving translation (M1)
eg, sketch,
(exact) A1 N2
(ii) valid approach involving the derivative of or (seen anywhere) (M1)
eg, max on derivative, sketch of derivative
attempt to find max value on derivative M1
eg, dot on max of sketch
3.14159
max rate of change (exact), 3.14 A1 N2
[6 marks]
Examiners report
A jar contains 5 red discs, 10 blue discs and green discs. A disc is selected at random and replaced. This process is performed four times.
Write down the probability that the first disc selected is red.
Let be the number of red discs selected. Find the smallest value of for which .
Markscheme
* This question is from an exam for a previous syllabus, and may contain minor differences in marking or structure.
A1 N1
[1 mark]
recognizing binomial distribution (M1)
eg
correct value for the complement of their (seen anywhere) A1
eg
correct substitution into (A1)
eg
(A1)
A1 N3
[5 marks]